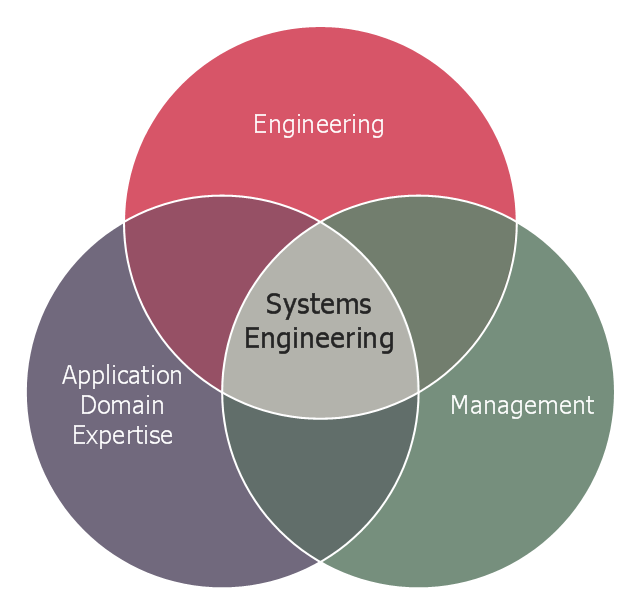
This Venn diagram sample shows the system engineering at the intersection of enginnering, management, and application domain expertise. It was designed on the base of the Venn diagram on the webpage "Intelligent Transportation Systems (ITS) ePrimer, Module 2: Systems Engineering" from the website of the Office of the Assistant Secretary for Research and Technology (OST-R), the U.S. Department of Transportation (US DOT).
"The term interdisciplinary is a fundamental concept in systems engineering. To successfully develop a system requires the application of basic engineering discipline, management discipline, and expertise in the application domain of the system. In the case of ITS, that application domain is transportation engineering. The intersection of these disciplines is the realm of systems engineering."
[pcb.its.dot.gov/ eprimer/ module2.aspx]
The Venn diagram example "Systems engineering improvement" was created using the ConceptDraw PRO diagramming and vector drawing software extended with the Venn Diagrams solution from the area "What is a Diagram" of ConceptDraw Solution Park.
Venn diagram
UML Class Diagram Example for Transport System

 Vehicular Networking
Network engineering is an extensive area with wide range of applications. Depending to the field of application, network engineers design and realize small networks or complex networks, which cover wide territories. In latter case will be ideal recourse to specialized drawing software, such as ConceptDraw PRO.
UML Class Diagram Example for GoodsTransportation System

UML Class Diagrams. Diagramming Software for Design UML Diagrams


 ConceptDraw Solution Park
ConceptDraw Solution Park collects graphic extensions, examples and learning materials
 Computer and Network Package
Computer and Network Package is a large set of valuable graphical solutions from ConceptDraw Solution Park, developed and specially selected to help computer network specialists and IT professionals to realize their daily work the most efficiently and quickly. This package contains extensive set of graphic design tools, ready-to-use vector elements, built-in templates and samples for designing professional-looking diagrams, charts, schematics and infographics in a field of computer network technologies, cloud computing, vehicular networking, wireless networking, ensuring networks security and networks protection. It is useful for designing different floor plans and layout plans for homes, offices, hotels and instantly construction detailed schemes of computer networks and wireless networks on them, for making professional-looking and colorful Pie Charts, Bar Graphs and Line Charts visualizing the relevant information and data.
 Fishbone Diagrams
The Fishbone Diagrams solution extends ConceptDraw PRO v10 software with the ability to easily draw the Fishbone Diagrams (Ishikawa Diagrams) to clearly see the cause and effect analysis and also problem solving. The vector graphic diagrams produced using this solution can be used in whitepapers, presentations, datasheets, posters, and published technical material.
 Computer and Networks Area
The solutions from Computer and Networks Area of ConceptDraw Solution Park collect samples, templates and vector stencils libraries for drawing computer and network diagrams, schemes and technical drawings.
 Aerospace and Transport
This solution extends ConceptDraw PRO software with templates, samples and library of vector clipart for drawing the Aerospace and Transport Illustrations. It contains clipart of aerospace objects and transportation vehicles, office buildings and anci
 Metro Map
Metro Map solution extends ConceptDraw PRO software with templates, samples and library of vector stencils for drawing the metro maps, route maps, bus and other transport schemes, or design tube-style infographics.
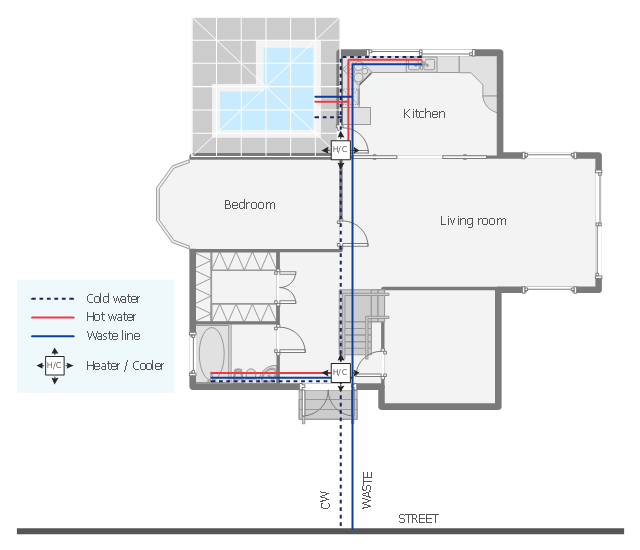
This plumbing and piping plan sample depicts the house hot and cold water supply and sanitation system.
"Within industry, piping is a system of pipes used to convey fluids (liquids and gases) from one location to another. The engineering discipline of piping design studies the efficient transport of fluid. ...
Plumbing is a piping system with which most people are familiar, as it constitutes the form of fluid transportation that is used to provide potable water and fuels to their homes and businesses. Plumbing pipes also remove waste in the form of sewage, and allow venting of sewage gases to the outdoors. Fire sprinkler systems also use piping, and may transport nonpotable or potable water, or other fire-suppression fluids." [Piping. Wikipedia]
The water supply and waste removal system scheme example "House plumbing plan" was created using the ConceptDraw PRO diagramming and vector drawing software extended with the Plumbing and Piping Plans solution from the Building Plans area of ConceptDraw Solution Park.
Plumbing and piping plan
 GHS Hazard Pictograms
GHS Hazard Pictograms solution contains the set of predesigned standard GHS pictograms, Hazardous symbols, and Hazard communication pictograms, approved and agreed by UN in Globally Harmonized System of Classification and Labelling of Chemicals (GHS). They can be used for quick and simple designing accurate and professional-looking infographics, diagrams, warning announcements, signboards, posters, precautionary declarations, regulatory documents, and for representing the main items of OSHA HAZCOM Standard.
 Logistics Flow Charts
Logistics Flow Charts solution extends ConceptDraw PRO v11 functionality with opportunities of powerful logistics management software. It provides large collection of predesigned vector logistic symbols, pictograms, objects and clipart to help you design with pleasure Logistics flow chart, Logistics process flow diagram, Inventory flow chart, Warehouse flowchart, Warehouse management flow chart, Inventory control flowchart, or any other Logistics diagram. Use this solution for logistics planning, to reflect logistics activities and processes of an enterprise or firm, to depict the company's supply chains, to demonstrate the ways of enhancing the economic stability on the market, to realize logistics reforms and effective products' promotion.
- Intelligent transportation system | Vehicular Networking | Systems ...
- UML Class Diagram Example for Transport System | Systems ...
- Model Based Systems Engineering | Systems Engineering ...
- UML Class Diagram Example for Transport System
- Intelligent transportation system | Transportation Infographics | UML ...
- UML Class Diagram Example for Transport System
- Transportation Engineering Clipart
- Model Based Systems Engineering | Systems engineering ...
- Systems engineering improvement | Venn Diagrams | Functional ...
- UML Class Diagram Example for Transport System
- Model Based Systems Engineering | Functional Block Diagram ...
- Venn diagrams - Vector stencils library | Systems engineering ...
- Venn Diagrams | Systems engineering improvement | Chemical and ...
- Systems engineering improvement | Venn Diagrams | Chemical and ...
- Application Of Venn Diagram In Engineering
- Venn Diagram Examples For Engineers
- Transportation Engineering Charts
- Process Of Er Diagram For Transport Management System
- Circuit Diagram For Bus Transportation System
- Database Design For Transport Management System Pdf