Design Pictorial Infographics. Design Infographics

Pictorial Chart

Sample Pictorial Chart. Sample Infographics
")
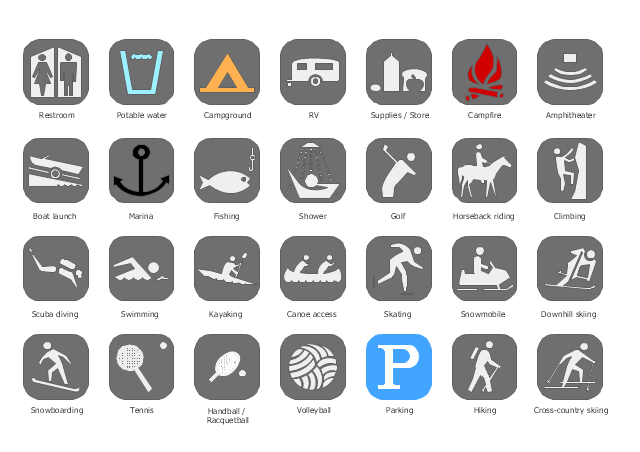
The vector stencils library "Recreation signs" contains 28 pictogram symbols for labeling the street and locator maps, road and route maps, transit and tourist maps with information signs using the ConceptDraw PRO diagramming and vector drawing software.
"An information sign is a very legibly printed and very noticeable placard that informs people of the purpose of an object, or gives them instruction on the use of something. An example is a traffic sign such as a stop sign.
Information signs have been growing in visibility due to the explosion of sign technologies." [Information sign. Wikipedia]
"A tourist sign, often referred to as a brown sign, is a traffic sign whose purpose is to direct visitors to tourist destinations, such as historic buildings, tourist regions, caravan or camp sites, picnic areas, sporting facilities and cultural places such as museums. By international convention, brown signs with white lettering and white pictograms are often used for this purpose." [Tourist sign. Wikipedia]
The vector stencils library "Recreation signs" is included in the Directional Maps solution from the Maps area of ConceptDraw Solution Park.
Recreation signs
Aerospace - Design Elements

How to Draw Pictorial Chart. How to Use Infograms

Process Flowchart


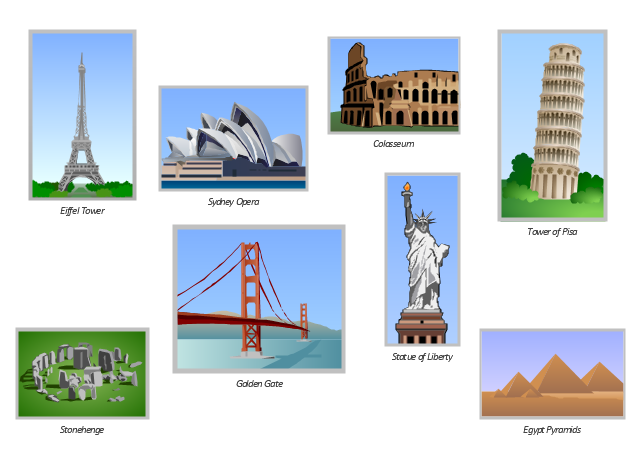
The vector clipart library Architecture contains 8 images of famous world architecture landmarks: Egypt pyramids, Stonehenge, Colosseum, Tower of Pisa, Statue of Liberty, Eiffel Tower, Golden Gate, Sydney Opera.
Use the vector stencils library Architecture to draw your own illustrations with images of the great architectural constructions, monuments and tourist attractions using the ConceptDraw PRO diagramming and vector drawing software.
"A monument is a type of structure that was explicitly created to commemorate a person or important event, or which has become important to a social group as a part of their remembrance of historic times or cultural heritage, or as an example of historic architecture. The term 'monument' is often applied to buildings or structures that are considered examples of important architectural and/ or cultural heritage." [Monument. Wikipedia]
The example "Design elements - Architecture" is included in the Artwork solution from the Illustration area of ConceptDraw Solution Park.
Vector clip art
UML Use Case Diagram. Design Elements
")

 Aerospace and Transport
This solution extends ConceptDraw PRO software with templates, samples and library of vector clipart for drawing the Aerospace and Transport Illustrations. It contains clipart of aerospace objects and transportation vehicles, office buildings and anci
Travel Infographics

Transportation Infographics

Ishikawa Diagram

 Presentation Clipart
Presentation design elements solution extends ConceptDraw PRO software with slide samples, templates and vector stencils libraries with design elements of presentation symbols, arrows, callouts, backgrounds, borders and frames, title blocks.
Infographic Software

- Travel and tourism pictograms - Vector stencils library | Travel ...
- Travel and tourism pictograms - Vector stencils library | Plane ...
- Map symbols - Vector stencils library | Travel and tourism pictograms ...
- Travel and tourism pictograms - Vector stencils library | Qualifying ...
- Tourism Symbols Png
- Travel and tourism pictograms - Vector stencils library | Travel and ...
- Map symbols - Vector stencils library
- Travel and tourism pictograms - Vector stencils library | Basic ...
- Travel and tourism pictograms - Vector stencils library | Travelling to ...
- Mountain Vector Png
- Travel and tourism pictograms - Vector stencils library | Travel and ...
- Travel and tourism pictograms - Vector stencils library | Travel and ...
- Travel and tourism pictograms - Vector stencils library | Design ...
- Marketing Plan Infographic | Design Pictorial Infographics. Design ...
- Travel and tourism pictograms - Vector stencils library | Process ...
- Geography - Vector stencils library | Workflow diagram - Weather ...
- Tourist Airplane Png
- Mountains Vector Png
- Sales workflow - Vector stencils library | Travel and tourism ...
- Snowboard - Winter sports pictograms | Watercraft - Vector stencils ...