Project Timeline

Timeline Examples

Timeline Diagrams

How to Make a Timeline

 Business Processes
Business Process solution extends ConceptDraw DIAGRAM software with business process diagrams as cross-functional flowcharts, workflows, process charts, IDEF0, timelines, calendars, Gantt charts, business process modeling, audit and opportunity flowcharts.
HelpDesk
How to Create a Timeline Diagram

Business diagrams & Org Charts with ConceptDraw DIAGRAM


 Timeline Diagrams
Timeline Diagrams solution extends ConceptDraw DIAGRAM diagramming software with samples, templates and libraries of specially developed smart vector design elements of timeline bars, time intervals, milestones, events, today marker, legend, and many other elements with custom properties, helpful for professional drawing clear and intuitive Timeline Diagrams. Use it to design simple Timeline Diagrams and designate only the main project stages, or highly detailed Timeline Diagrams depicting all project tasks, subtasks, milestones, deadlines, responsible persons and other description information, ideal for applying in presentations, reports, education materials, and other documentation.
 Marketing
This solution extends ConceptDraw DIAGRAM and ConceptDraw MINDMAP with Marketing Diagrams and Mind Maps (brainstorming, preparing and holding meetings and presentations, sales calls).
 ConceptDraw Solution Park
ConceptDraw Solution Park collects graphic extensions, examples and learning materials
"Value stream mapping is a lean management principle used to analyze and design the flow of materials and information required to bring a product or service to a consumer. Pioneered by Henry Ford in the 1920s, perfected by Toyota. At Toyota, it is known as "material and information flow mapping". It can be applied to nearly any value chain. ...
Value stream mapping has supporting methods that are often used in Lean environments to analyze and design flows at the system level (across multiple processes).
Although value stream mapping is often associated with manufacturing, it is also used in logistics, supply chain, service related industries, healthcare, software development, product development, and administrative and office processes." [Value stream mapping. Wikipedia]
This value stream map template explains the meanings of the VSM design elements.
This Value stream map template for the ConceptDraw PRO diagramming and vector drawing software is included in the Value Stream Mapping solution from the Quality area of ConceptDraw Solution Park.
VSM template
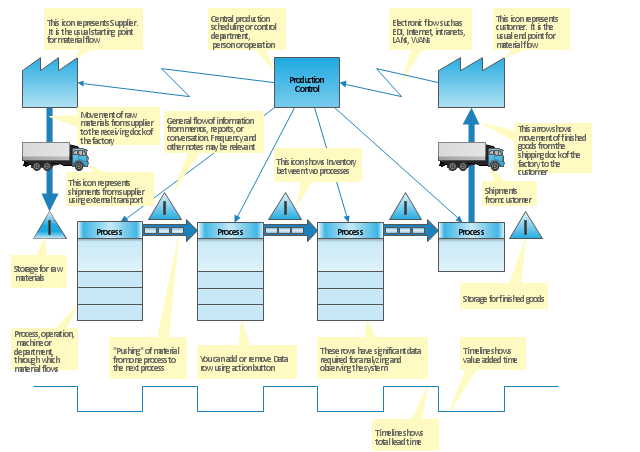
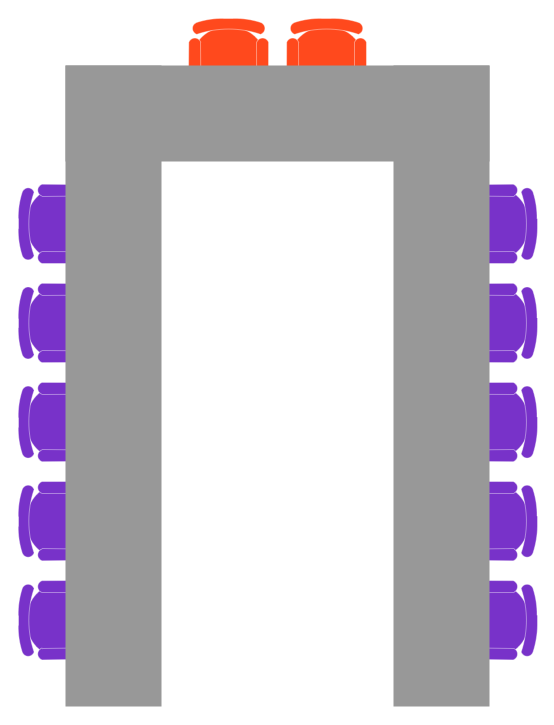
Table Seating Chart Template
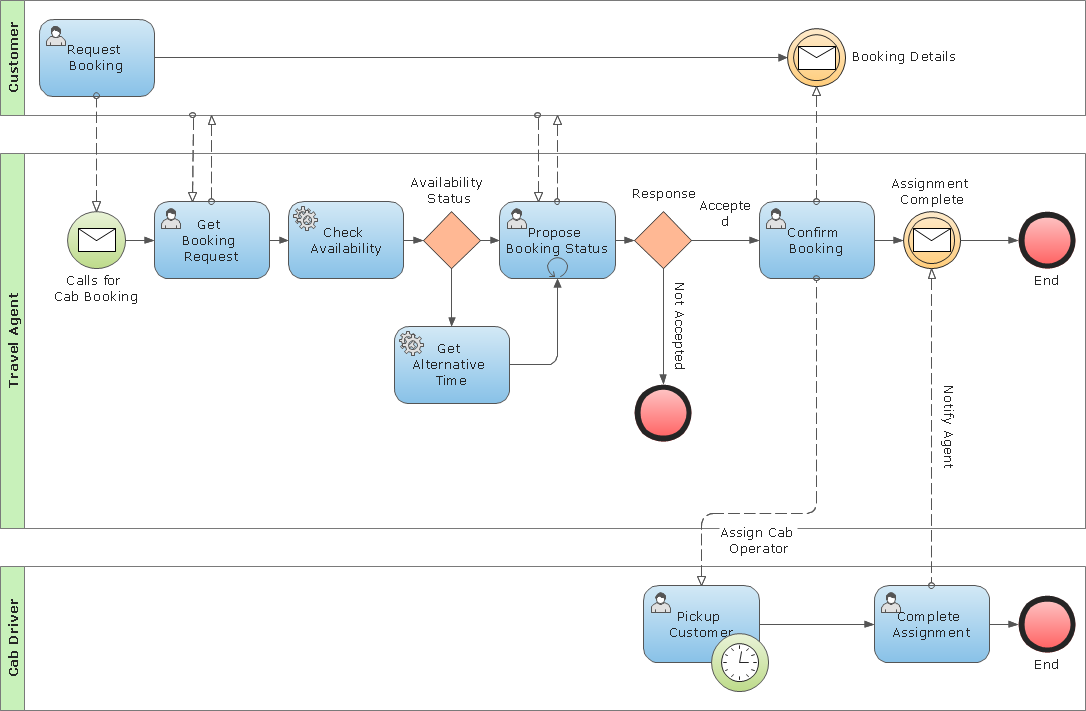
Business Process Modeling Notation Template
Fishbone Diagram Template

 Quality
This solution extends ConceptDraw DIAGRAM and ConceptDraw MINDMAP with Quality Management Diagrams (Total Quality Management Diagrams, Timelines, Workflows, Value Stream Maps) and Mind Maps (Presentations, Meeting Agendas, Problem to be solved).
- How to Create a Timeline Diagram in ConceptDraw PRO | Timeline ...
- Project Timeline Templates
- Timeline - Template | Timeline - Template | Business diagrams ...
- Timeline template | Marketing | Management | A Timeline Template
- Timeline Diagrams | How to Create a Timeline Diagram in ...
- | Project Timeline | Timeline Examples | Timeline Template
- Timeline template | Management | Business Processes | Time Line ...
- Timeline Free Samples
- How to Create a Timeline Diagram in ConceptDraw PRO | How to ...
- Timeline template | Timeline template | Marketing | Timeline ...
- Timeline - Template | Timeline Diagrams | Marketing | Project Time ...
- Timeline Diagrams | Timeline Examples | How to Create a Timeline ...
- Timeline Diagrams | Timeline Diagrams | Area Charts | Sample Of A ...
- | Bar Chart Template for Word | Timeline Diagrams | Chronological ...
- | Timeline Diagrams | Manufacturing and Maintenance | Timelines ...
- Timeline Examples | How to Create a Timeline Diagram in ...
- How to Make a Timeline | How to Create a Timeline Diagram in ...
- How to Make a Timeline | Timeline Diagrams | Project Timeline ...
- Timeline Diagrams | Mac OS X User Interface | Program Evaluation ...
- Timeline diagram template | Design elements - Timelines solution ...