Timeline Examples

How to Make a Timeline

How To Create a FlowChart using ConceptDraw

 Business Processes
Business Process solution extends ConceptDraw DIAGRAM software with business process diagrams as cross-functional flowcharts, workflows, process charts, IDEF0, timelines, calendars, Gantt charts, business process modeling, audit and opportunity flowcharts.
Emergency Action Plan Template

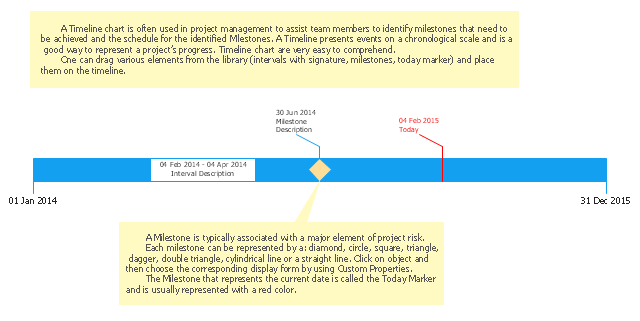
Project Timeline

Timeline charts presents events and time periods on a chronological scale. They are used in project management to visualize project milestones and upper level phases, and show project progress.
"Time is one of the most critical resources in any project. Good planning spreads the necessary work over a reasonable period of time. This allows everyone to work at a consistent, sustainable pace. Poor planning leaves people stuck and idle, then forces them to scramble to catch up later on. While it does take time to plan ahead, the time ... saved more than make up for it. Good planning is a part of good doing. ...
A Timeline is a clean and concise visual representation of a series of events. It helps you to arrange large chunks of time and see the overall plan easily." [education.rec.ri.cmu.edu/ previews/ nxt_ products/ robotics_ eng_ vol_ 2/ preview/ content/ timeline.pdf]
This timeline template for the ConceptDraw PRO diagramming and vector drawing software is included in the Timeline Diagrams solution from the Management area of ConceptDraw Solution Park.
Timeline template
What is Interactive Flowcharts

How To Create a Flow Chart in ConceptDraw

Fishbone Problem Solving

Calendar Templates

How To Implement Collaborative Project Management


PERT Chart

Examples of Flowcharts, Org Charts and More


Line Graph

Scatter Chart Examples

What is Gantt Chart (historical reference)
 *")
Social Media Response Management DFD Charts - software tools


Best Software for Making Presentations

Audit Steps

- Timeline Diagrams | Flowchart Of The Creation Of Parks A Timeline
- Timeline Diagrams | Enterprise Architecture Diagrams | Flowchart ...
- Timeline Diagrams | Flowchart Software | Fishbone Diagram ...
- Timeline Diagrams | Free Timeline Template For Microsoft Word
- Timeline Diagrams | Examples Of Process Timelines
- Timeline Examples | Project Timeline | Timeline Diagrams | Visio ...
- Timeline Diagrams | Flowchart Software | SWOT and TOWS Matrix ...
- Project Timeline | Timeline Examples | How to Make a Timeline ...
- Cross-Functional Flowcharts | Accounting Flowcharts | Flowcharts ...
- Timeline Diagrams | Flowchart Software | Project Timeline | Microsoft ...