Flow Chart Symbols

Accounting Flowchart Symbols

Accounting Information Systems Flowchart Symbols

Basic of Flowchart: Meaning and Symbols


The vector stencils library "Flowchart" contains 26 symbols for drawing flowcharts.
Use these shapes to draw your flow charts in the ConceptDraw PRO diagramming and vector drawing software extended with the Flowcharts solution from the area "What is a Diagram" of ConceptDraw Solution Park.
www.conceptdraw.com/ solution-park/ diagram-flowcharts
Use these shapes to draw your flow charts in the ConceptDraw PRO diagramming and vector drawing software extended with the Flowcharts solution from the area "What is a Diagram" of ConceptDraw Solution Park.
www.conceptdraw.com/ solution-park/ diagram-flowcharts
Terminator

Process

Decision

Delay

Subroutine

Data

Document

Multiple documents

Preparation

Display

Manual input

Manual loop

Loop limit

Connector

Off-page connector

Off-page connector

Off-page connector

Off-page connector

Or

Summing junction

Collate

Sort

Merge

Stored data

Database

Internal storage

The vector stencils library "Sales flowchart" contains 62 sales process flow chart symbols.
Use these flow chart icon set to draw your sales flowcharts, workflow diagrams and process charts with the ConceptDraw PRO diagramming and vector drawing software.
The sales process flowchart symbols library "Sales flowchart" is included in the Sales Flowcharts solution from the Marketing area of ConceptDraw Solution Park.
Annotation

Card

Check / audit (diamond)
-sales-flowchart---vector-stencils-library.png--diagram-flowchart-example.png)
Check / audit (square)
-sales-flowchart---vector-stencils-library.png--diagram-flowchart-example.png)
Collate

Comment / note symbol (brace)
-sales-flowchart---vector-stencils-library.png--diagram-flowchart-example.png)
Communication link

Compare (diamond)
-sales-flowchart---vector-stencils-library.png--diagram-flowchart-example.png)
Compare (square)
-sales-flowchart---vector-stencils-library.png--diagram-flowchart-example.png)
Completed form

Concurrency symbol (fork / join)
-sales-flowchart---vector-stencils-library.png--diagram-flowchart-example.png)
Conditional selector

Control transfer

Database

Data input / output

Decision

Decision indicator - No

Decision indicator - Yes

Delay

Direct access storage

Disk storage

Display

Divided process (table view)
-sales-flowchart---vector-stencils-library.png--diagram-flowchart-example.png)
Document

Entity (rounded)
-sales-flowchart---vector-stencils-library.png--diagram-flowchart-example.png)
Event

Extract

Flow line

Internal storage

Junction symbol

Lined document

Lined / shaded process

Loop limit

Manual file

Manual input

Manual operation

Merge

Multi document

Multi process

Off-page reference - arrow
Off-page reference - incoming

Off-page reference - outgoing

On-page reference/ Inspection point

Or

Page

Paper tape

Predefined process

Prepare conditional

Process step

Reference point

Sequential access storage

Sort

Start (circle)
-sales-flowchart---vector-stencils-library.png--diagram-flowchart-example.png)
Start (ellipse)
-sales-flowchart---vector-stencils-library.png--diagram-flowchart-example.png)
Stickman pictogram

Stored data

Summary

Tagged document

Tagged process

Terminal point

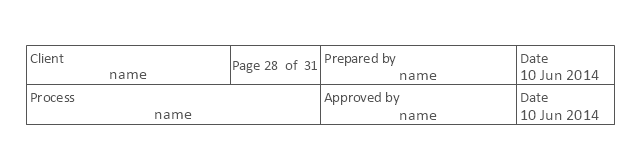
Title block

Torso pictogram

The vector stencils library "HR flowchart" contains 62 flowchart symbols.
Use it to draw your HR flowcharts, workflow diagrams and process charts with the ConceptDraw PRO diagramming and vector drawing software.
The flow chart symbols library "HR flowchart" is included in the HR Flowcharts solution from the Management area of ConceptDraw Solution Park.
Use it to draw your HR flowcharts, workflow diagrams and process charts with the ConceptDraw PRO diagramming and vector drawing software.
The flow chart symbols library "HR flowchart" is included in the HR Flowcharts solution from the Management area of ConceptDraw Solution Park.
Annotation

Card

Check / audit (diamond)
-hr-flowchart---vector-stencils-library.png--diagram-flowchart-example.png)
Check / audit (square)
-hr-flowchart---vector-stencils-library.png--diagram-flowchart-example.png)
Collate

Comment / note symbol (brace)
-hr-flowchart---vector-stencils-library.png--diagram-flowchart-example.png)
Communication link

Compare (diamond)
-hr-flowchart---vector-stencils-library.png--diagram-flowchart-example.png)
Compare (square)
-hr-flowchart---vector-stencils-library.png--diagram-flowchart-example.png)
Completed form

Concurrency symbol (fork / join)
-hr-flowchart---vector-stencils-library.png--diagram-flowchart-example.png)
Conditional selector

Control transfer

Data input / output

Database

Decision

Decision indicator - No

Decision indicator - Yes

Delay

Direct access storage

Disk storage

Display

Divided process (table view)
-hr-flowchart---vector-stencils-library.png--diagram-flowchart-example.png)
Document

Entity (rounded)
-hr-flowchart---vector-stencils-library.png--diagram-flowchart-example.png)
Event

Extract

Flow line

Internal storage

Junction symbol

Lined document

Lined / shaded process

Loop limit

Manual file

Manual input

Manual operation

Merge

Multi document

Multi process

Off-page reference - arrow
Off-page reference - incoming

Off-page reference - outgoing

On-page reference/ Inspection point

Or

Page

Paper tape

Predefined process

Prepare conditional

Process step

Reference point

Sequential access storage

Sort

Start (circle)
-hr-flowchart---vector-stencils-library.png--diagram-flowchart-example.png)
Start (ellipse)
-hr-flowchart---vector-stencils-library.png--diagram-flowchart-example.png)
Stickman pictogram

Stored data

Summary

Tagged document

Tagged process

Terminal point

Title block

Torso pictogram

Flowchart Design Flowchart Symbols, Shapes, Stencils and Icons


The vector stencils library "Cross-functional flowcharts" contains 31 flow chart symbols. Use it for drawing cross-functional and deployment flowcharts the ConceptDraw PRO diagramming and vector drawing software extended with the Cross-Functional Flowcharts solution from the Business Processes area of ConceptDraw Solution Park.
Swimlanes Vertical
Swimlanes Horizontal

Terminator

Process

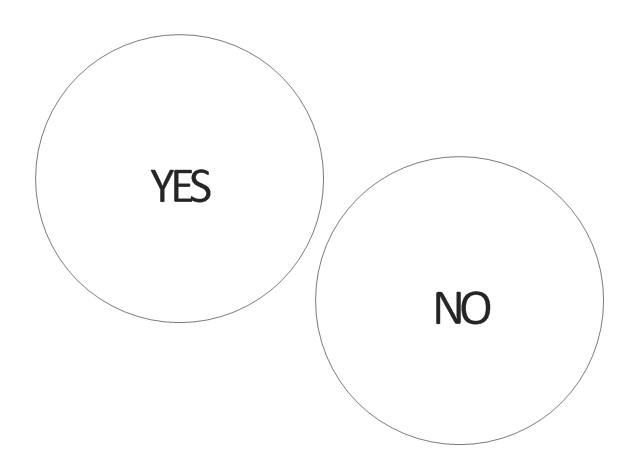
Decision

Yes

No

YES/NO
Data

Manual Operation

Document

Predefined Process

Stored Data

Internal Storage

Sequential Data

Direct Data
Manual Input

Card

Paper Tape

Display
Preparation

Parallel Mode

Loop limit

On-page Reference

Off-Page Reference (Outgoing)
-cross-functional-flowcharts---vector-stencils-library.png--diagram-flowchart-example.png)
Off-Page Reference (Incoming)
-cross-functional-flowcharts---vector-stencils-library.png--diagram-flowchart-example.png)
Off-page Reference (Circle)
-cross-functional-flowcharts---vector-stencils-library.png--diagram-flowchart-example.png)
Off-Page Reference (Arrow)
-cross-functional-flowcharts---vector-stencils-library.png--diagram-flowchart-example.png)
Annotation
Control Transfer
Condition
Electrical Symbols — Semiconductor

The vector stencils library "Audit flowcharts" contains 31 flow chart symbols.
Use it in accounting, financial management, fiscal information tracking, money management, decision making, and financial inventories to create auditing flowchart diagrams in the ConceptDraw PRO diagramming and vector drawing software extended with the Audit Flowcharts solution from the Finance and Accounting area of ConceptDraw Solution Park.
www.conceptdraw.com/ solution-park/ finance-audit-flowcharts
Tagged Process

Tagged Document

Decision

Manual operation

Terminator

Manual File

Display

On-page reference

Off-page reference

Divided (Table View)
-audit-flowcharts---vector-stencils-library.png--diagram-flowchart-example.png)
Process

Lined / shaded process

Lined Document

Document

Database

Disk Storage

Floppy disk

Magnetic Tape

Data Transmission

Manual input

Check 1 (audit)
-audit-flowcharts---vector-stencils-library.png--diagram-flowchart-example.png)
Compare 1

Reference point

Check 2 (audit)
-audit-flowcharts---vector-stencils-library.png--diagram-flowchart-example.png)
Compare 2

Event

Entity (Rounded Corners)
-audit-flowcharts---vector-stencils-library.png--diagram-flowchart-example.png)
Title Block
Condition

Input/ Output

Delay

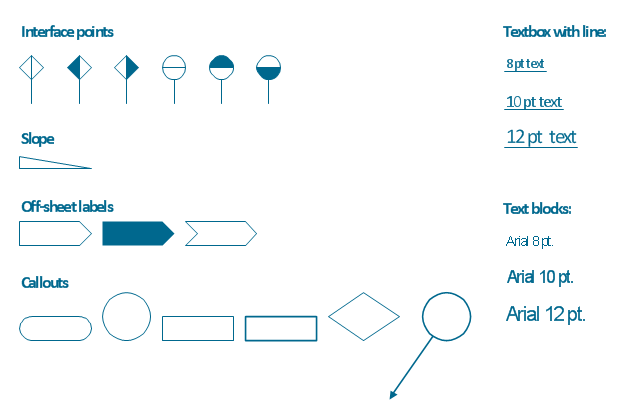
The vector stencils library "Process annotations" contains 22 symbols of interface points, slope, off-sheet labels, callouts and textboxes.
Use these shapes for setting automatic labels to display a datasheet field for a pipeline shape, labels, captions, outlines, off-sheet labels, text balloons, annotations, outlines, tags, and descriptions.
"In engineering a process is a set of interrelated tasks that, together, transform inputs into outputs. These tasks may be carried out by people, nature, or machines using resources; so an engineering process must be considered in the context of the agents carrying out the tasks, and the resource attributes involved. Systems Engineering normative documents and those related to Maturity Models are typically based on processes. For example, System Engineering processes of the EIA-632 and processes involved in the Capability Maturity Model Integration (CMMI) institutionalization and improvement approach. Constraints imposed on the tasks and resources required to implement them are essential for executing the tasks mentioned.
A chemical process is a series of unit operations used to produce a material in large quantities.
In the chemical industry, chemical engineers will use the following to define or illustrate a process:
Process Flow Diagram (PFD),
Piping and instrumentation diagram
(P&ID),
Simplified process description,
Detailed process description,
Project management,
Process simulation." [Process (engineering). Wikipedia]
The example "Design elements - Process annotations" was created using the ConceptDraw PRO diagramming and vector drawing software extended with the Chemical and Process Engineering solution from the Engineering area of ConceptDraw Solution Park.
Process annotation symbols
The vector stencils library "HR flowchart" contains 62 flowchart symbols.
Use it to draw your HR flowcharts, workflow diagrams and process charts with the ConceptDraw PRO diagramming and vector drawing software.
The flow chart symbols library "HR flowchart" is included in the HR Flowcharts solution from the Management area of ConceptDraw Solution Park.
Use it to draw your HR flowcharts, workflow diagrams and process charts with the ConceptDraw PRO diagramming and vector drawing software.
The flow chart symbols library "HR flowchart" is included in the HR Flowcharts solution from the Management area of ConceptDraw Solution Park.
Annotation
Card
Check / audit (diamond)
Check / audit (square)
Collate
Comment / note symbol (brace)
Communication link
Compare (diamond)
Compare (square)
Completed form
Concurrency symbol (fork / join)
Conditional selector
Control transfer
Data input / output
Database
Decision
Decision indicator - No
Decision indicator - Yes
Delay
Direct access storage
Disk storage
Display
Divided process (table view)
Document
Entity (rounded)
Event
Extract
Flow line
Internal storage
Junction symbol
Lined document
Lined / shaded process
Loop limit
Manual file
Manual input
Manual operation
Merge
Multi document
Multi process
Off-page reference - arrow
Off-page reference - incoming
Off-page reference - outgoing
On-page reference/ Inspection point
Or
Page
Paper tape
Predefined process
Prepare conditional
Process step
Reference point
Sequential access storage
Sort
Start (circle)
Start (ellipse)
Stickman pictogram
Stored data
Summary
Tagged document
Tagged process
Terminal point
Title block
Torso pictogram
The vector stencils library "Accounting flowcharts" contains 14 flow chart symbols.
This library was created according the article " Accounting Flowchart: Purchasing, Receiving, Payable and Payment"
http:/ / accounting-financial-tax.com/ 2010/ 04/ accounting-flowchart-purchasing-receiving-payable-and-payment/
from the website " Accounting Financial Tax" http:/ / accounting-financial-tax.com , with the kind permission of the author.
Use this library for drawing the accounting flowcharts in the ConceptDraw PRO software extended with the Accounting Flowcharts solution from the Finance and Accounting area of ConceptDraw Solution Park.
www.conceptdraw.com/ solution-park/ finance-accounting-flowcharts
On-page Connector

Off-page Connector

Punched Card

Annotation

Magnetic Tape

Punched Tape

Manual Input

Angled Connector

Double Tree Connector

Magnetic Disk

Manual File

Process

Manual Operation

Document

Audit Flowchart Symbols

 One-line Diagrams
One-line Diagrams solution is a powerful electrical engineering tool to develop precise and detailed One-line Diagram, Single-line Diagram, Electrical diagram. This solution supplies the ConceptDraw DIAGRAM users with a wide set of vector libraries with special icons and electrical symbol elements for one-line drawing and electrical engineering diagram design including. It includes a large collection of samples of One-line Diagrams illustrating high-voltage and low-voltage systems, different electrical configurations and topologies, transmission systems, application of circuit breakers, protection electrical equipment, etc. It is perfect for all power-related workers, engineers, electricians, and other professionals working in power engineering and energy industries.
How to Build a Flowchart

Database Flowchart Symbols

Flowchart Software

- Basic Flowchart Symbols and Meaning | Flow Chart Symbols ...
- Flowchart | Flowchart Symbols And Off Page Connector
- Accounting Flowchart Symbols | Onpage And Off Page Connector ...
- Basic Flowchart Symbols and Meaning | Process Flowchart ...
- Basic Flowchart Symbols and Meaning | Off Page Connector Meaning
- Flowchart - Vector stencils library | Design elements - Accounting ...
- Flow Chart Symbols | Off Page Connector For Swimlane Diagram
- Basic Flowchart Symbols and Meaning | Process Flowchart | ERD ...
- Sales flowchart - Vector stencils library | Design elements - Process ...
- Basic Flowchart Symbols and Meaning | Process Flowchart | ERD ...