Example 1. Accounting Flowchart Symbols
The accounting flowcharts and diagrams created with help of ConceptDraw's Accounting Flowcharts solution let effectively represent the detailed structure of the process. Add the accounting flowchart symbols to the diagram by dragging them from the Accounting Flowcharts library to your ConceptDraw document page.
| Symbol |
Shape Name |
Symbol Description |
| Process / Operation Symbols |
 |
Process |
Any processing function. |
 |
On-page Connector |
Transfer of customer order to the credit department. |
 |
Off-page Connector |
Mailing of sales invoice to customer. |
 |
Annotation |
Used to describe or note an activity. |
 |
Punched Card |
Method of computer input, the data that are input by means of punched card. |
 |
Magnetic Tape |
Method of computer input, the data that are stored on magnetic tape. |
 |
Punched Tape |
Method of computer input, the data that are input by means of punched tape. |
 |
Manual Input |
Data that are entered manually with a keyboard or barcode reader. |
 |
Magnetic Disk |
Method of computer storage, the data that are stored on magnetic disk. |
 |
Manual File |
Data that are stored by non-electronic means. |
 |
Manual Operation |
Any operation that is performed manually (by a person). |
 |
Document |
Data that can be read by people, such as printed output. |
 |
Angled Connector |
Angled Connector. |
 |
Double Tree Connector |
Double Tree Connector. |
You can also assign the library objects with the Rapid Draw tool on the Shape toolbar, use the Rapid Draw arrows to create new objects automatically.
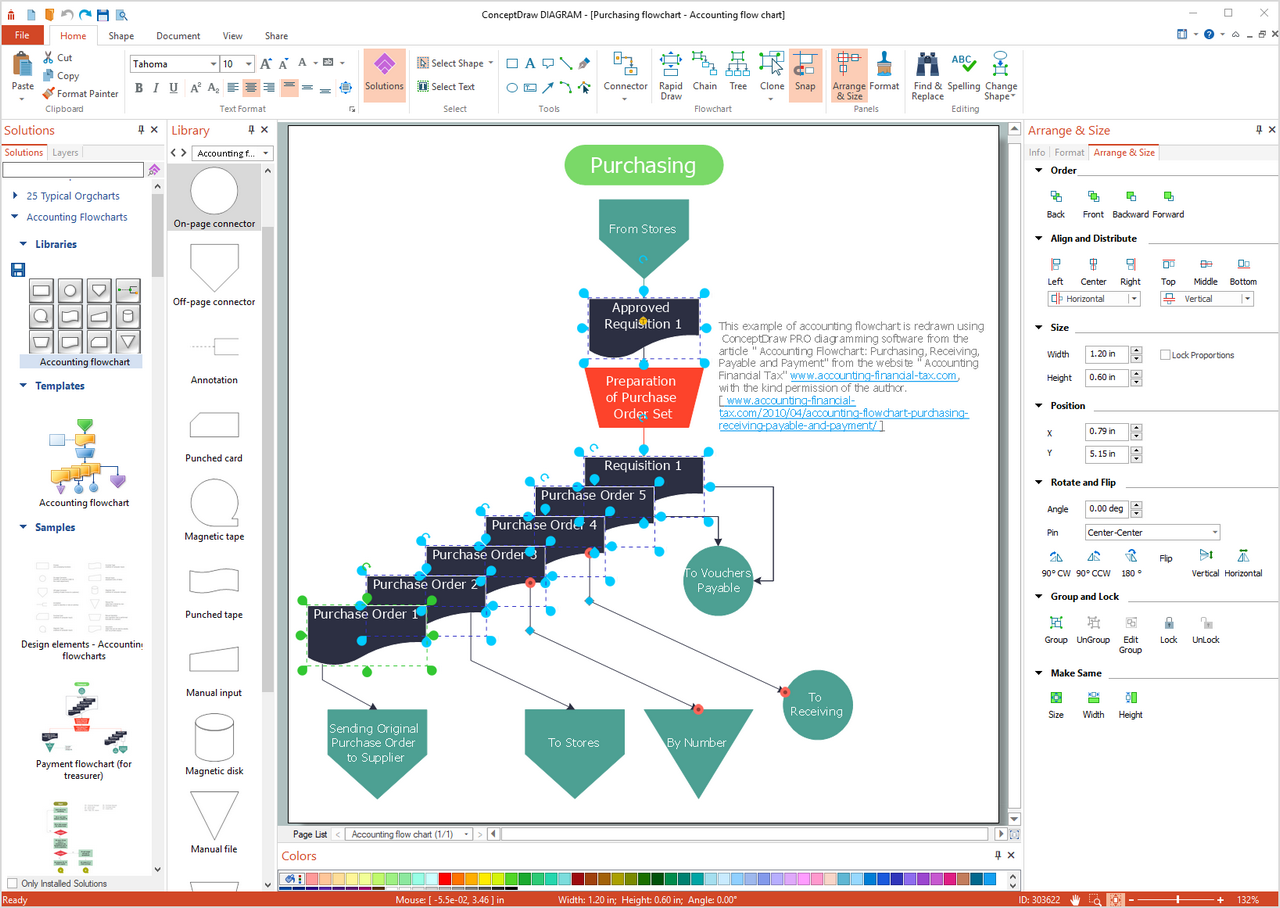
Example 2. Creation Voucher Payable Flowchart in ConceptDraw DIAGRAM
All Accounting Flowcharts created in ConceptDraw DIAGRAM are colorful, attractive, and will have a great success when used in whitepapers, datasheets, posters, published technical materials, presentations on conferences, meetings and various discussions with colleagues. Use the Line, Fill, Shadow and Text tools to format your Accounting Flowcharts.

Example 3. Accounting Flowchart Template
A number of samples and template are also included in Accounting Flowcharts solution and give to the ConceptDraw's users a base from which to explore the powerful diagramming tools of ConceptDraw DIAGRAM software. Thanks to the accounting flowchart template you can greatly save your time, all that you need to do is to make changes if required to the existing Accounting Flowchart. Open the Accounting Flowchart template from ConceptDraw STORE.

Example 4. Accounting Flowcharts Solution
Use the variety of accounting flowchart symbols from the Accounting Flowcharts library for Accounting Flowcharts Solution, and also collection of samples and template from ConceptDraw STORE to create your own professional looking Accounting Flowcharts of any complexity quick, easy and effective.
TEN RELATED HOW TO's:
A process flowchart is a picture of the separate steps of a process in sequential order.Use ConceptDraw DIAGRAM software and the vector stencils from object libraries are designed objects you can use adding to process flowcharts for the best result.
Picture: Create Process Flowcharts
Related Solution:
When trying to figure out the nature of the problems occurring within a project, there are many ways to develop such understanding. One of the most common ways to document processes for further improvement is to draw a process flowchart, which depicts the activities of the process arranged in sequential order — this is business process management. ConceptDraw DIAGRAM is business process mapping software with impressive range of productivity features for business process management and classic project management. This business process management software is helpful for many purposes from different payment processes, or manufacturing processes to chemical processes. Business process mapping flowcharts helps clarify the actual workflow of different people engaged in the same process. This samples were made with ConceptDraw DIAGRAM — business process mapping software for flowcharting and used as classic visio alternative because its briefly named "visio for mac" and for windows, this sort of software named the business process management tools.
This flowchart diagram shows a process flow of project management. The diagram that is presented here depicts the project life cycle that is basic for the most of project management methods. Breaking a project into phases allows to track it in the proper manner. Through separation on phases, the total workflow of a project is divided into some foreseeable components, thus making it easier to follow the project status. A project life cycle commonly includes: initiation, definition, design, development and implementation phases. Distinguished method to show parallel and interdependent processes, as well as project life cycle relationships. A flowchart diagram is often used as visual guide to project. For instance, it used by marketing project management software for visualizing stages of marketing activities or as project management workflow tools. Created with ConceptDraw DIAGRAM — business process mapping software which is flowcharting visio alternative or shortly its visio for mac, this sort of software platform often named the business process management tools.
Picture: Process Flowchart: A Step-by-Step Comprehensive Guide
Related Solution:
When you are a beginner in software development, you make a lot of mistakes. Developing logical models, or data flow diagrams is a way to see the the whole project and all the processes clearly. And some novices, unfortunately for them, miss modeling stage at the beginning of project life cycle, and get into troubles as the project grows.
This image represents the data flow diagram applying symbols of Yourdon and Coad notation. This DFD depicts the data flow inside an organization department deals with receivables. The icons of standard Yourdon and Coad notation provides possibility to draw professional looking and well- readable DFD for business documentation. This data flow diagram was designed with the help of ConceptDraw DIAGRAM and its Data Flow Diagrams solution. The solution delivers three vector graphic libraries including elements of Yourdon and Coad and Gane-Sarson notations.
Picture: Data Flow Diagram Process
Related Solution:
ConceptDraw - Perfect Network Diagramming Software with abundant examples and templates. ConceptDraw Network Diagram is ideal for network engineers and network designers who need to draw Enterprise Private Network diagrams.
Picture: Network Diagram SoftwareEnterprise Private Network
Related Solution:
UML Sequence Diagram shows object interactions arranged in time sequence, how processes operate with one another and in what order and illustrate the sequence of messages exchanged between the objects and classes involved in the scenario.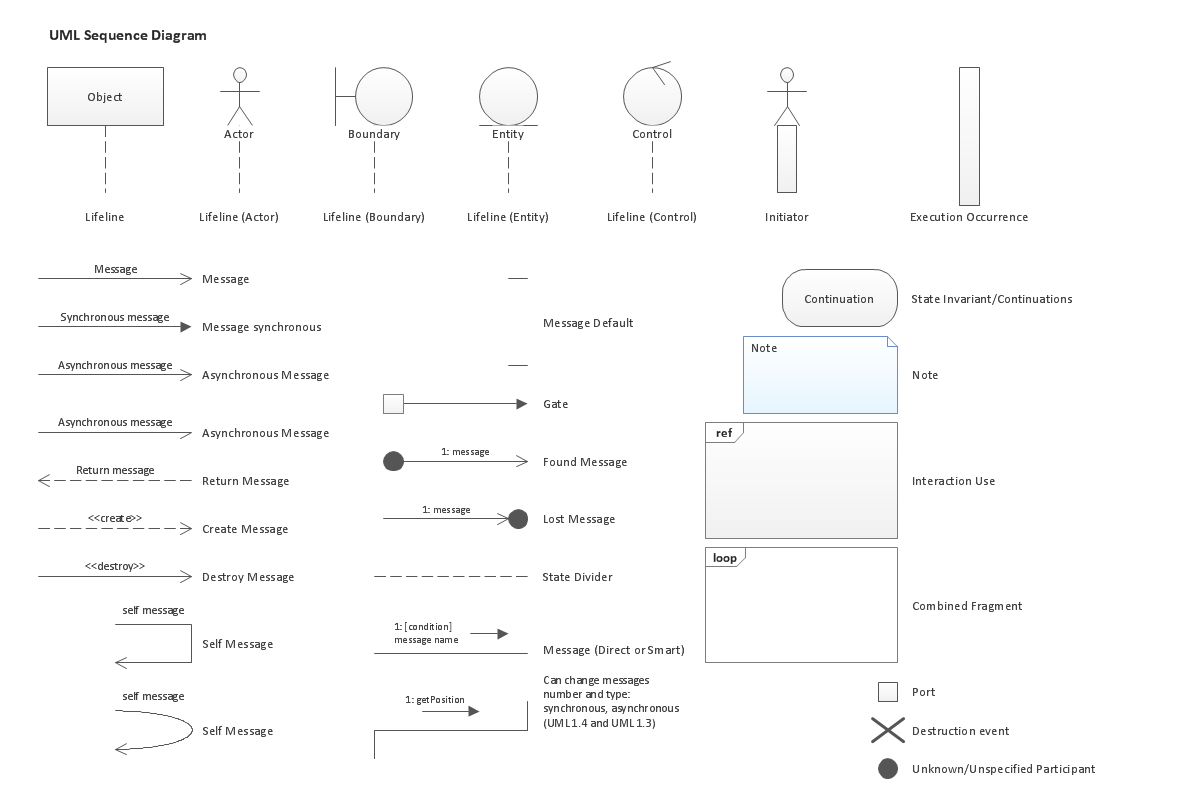
Picture: UML Sequence Diagram. Design Elements
While creating flowcharts and process flow diagrams, you should use special objects to define different statements, so anyone aware of flowcharts can get your scheme right. There is a short and an extended list of basic flowchart symbols and their meaning. Basic flowchart symbols include terminator objects, rectangles for describing steps of a process, diamonds representing appearing conditions and questions and parallelograms to show incoming data.
This diagram gives a general review of the standard symbols that are used when creating flowcharts and process flow diagrams. The practice of using a set of standard flowchart symbols was admitted in order to make flowcharts and other process flow diagrams created by any person properly understandable by other people. The flowchart symbols depict different kinds of actions and phases in a process. The sequence of the actions, and the relationships between them are shown by special lines and arrows. There are a large number of flowchart symbols. Which of them can be used in the particular diagram depends on its type. For instance, some symbols used in data flow diagrams usually are not used in the process flowcharts. Business process system use exactly these flowchart symbols.
Picture: Flowchart Symbols: Meaning and Examples
Related Solution:
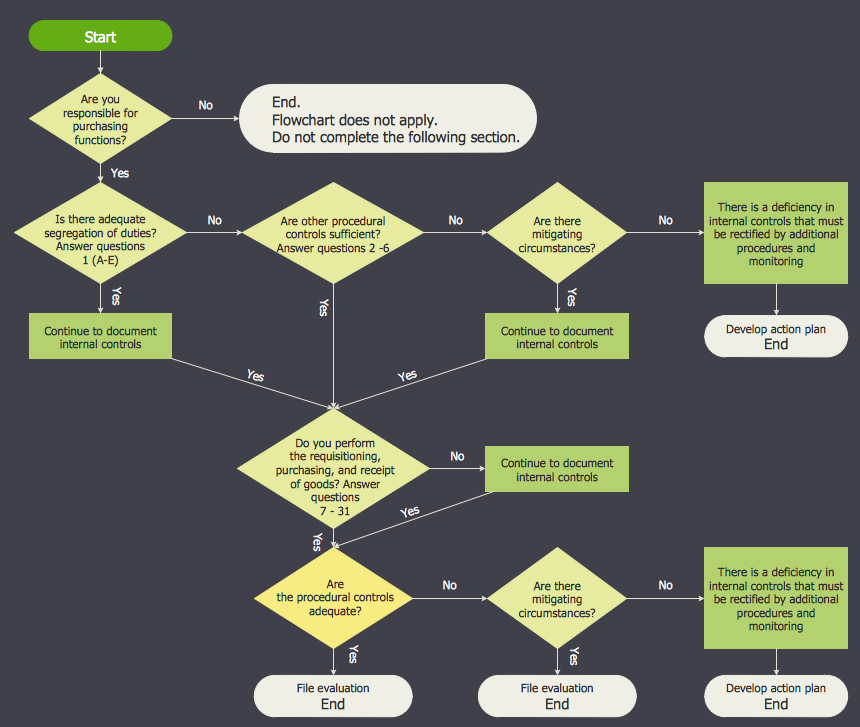
The Accounting flowchart shows how information flows from source documents through the accounting records. The are based on the accounting procedures or processes.
Flowcharts are used to represent accounting information in a system. There are special symbols which are used to create accounting flowcharts. Try conceptdraw flowcharting set of symbols to draw a professional charts.
Picture: Why Flowchart Important to Accounting Information System?
Related Solution:
Accounting Data Flow from the Accounting Flowcharts Solution visually describes the financial accounting process, shows the accumulated information about transactions and events for creating the balance sheet and the final income statement.
Accounting Flowcharts Solution contains also a wide variety of templates and samples that you can use as the base for your own Accounting Flowcharts of any complexity.
Picture: Accounting Data Flow from the Accounting Flowcharts Solution
Related Solution:
The most easier way of creating the visually engaging and informative Sales Process Flowchart is to create the new ConceptDraw document and to use the predesigned vector symbols offered in 6 libraries of the Sales Flowchart Solution. There are more than six types of sales process flow diagrams, ConceptDraw DIAGRAM software is flowchart maker which include six collections of extended flowchart symbols for effective diagramming. There are main collections of color coded flowchart symbols: Sales Department, Sales Steps, Sales Workflow, Sales Symbols and special set of Sales Arrows and Sales Flowchart.
Picture: Sales Process Flowchart Symbols
Related Solution:
When used in different areas, flowcharts use specific symbols to depict different elements. ConceptDraw DIAGRAM offers libraries of symbols for many areas. One of such libraries is flowchart symbols accounting, which provides symbols for accounting diagrams. Activity-based costing calculates the costs of all products and services based on activities in an organization. A type of accounting flowchart that shows how costs are assigned to products with resources and activities is called Activity-based costing (ABC) flowchart. It can be designed in a digital drawing software such as ConceptDraw DIAGRAM.
Here is an accounting flowchart template and symbols. These flowchart symbols are applied for making accounting flow charts in ConceptDraw DIAGRAM and with its Accounting Flowcharts solution. An accounting flowchart is a specific type of a flow diagram. Practically a number of flowchart-type diagrams commonly utilized to clarify many parts of an accounting department working process. Accounting flowchart assists a process of preparing accounting documentation. It shows who responsible for implementation of each step in the workflow of accounting department.
Picture:
Flowchart Symbols Accounting
Activity-based costing (ABC) flowchart
Related Solution:

