This site uses cookies. By continuing to browse the ConceptDraw site you are agreeing to our Use of Site Cookies.

Organizational Structure Total Quality Management

The Total Quality Management Diagram solution helps you and your organization visualize business and industrial processes. Create Total Quality Management diagrams for business process with ConceptDraw software.

Basic Flowchart Symbols and Meaning

Flowchart Symbols and Meaning - Provides a visual representation of basic flowchart symbols and their proposed use in professional workflow diagram, standard process flow diagram and communicating the structure of a well-developed web site, as well as their correlation in developing on-line instructional projects. See flowchart's symbols by specifics of process flow diagram symbols and workflow diagram symbols.
How to Build a Flowchart

Probability Quality Control Tools

The Total Quality Management Diagram solution helps your organization visualize business and industrial processes. Create Total Quality Management diagrams for business process with ConceptDraw software.

Process Flowchart

ConceptDraw is Professional business process mapping software for making process flow diagram, workflow diagram, general flowcharts and technical illustrations for business documents. It is includes rich examples, templates, process flowchart symbols. ConceptDraw flowchart maker allows you to easier create a process flowchart. Use a variety of drawing tools, smart connectors, flowchart symbols and shape libraries to create flowcharts of complex processes, process flow diagrams, procedures and information exchange.
How To Create a Process Flow Chart (business process modelling techniques)

Value Stream Mapping Symbols

VSM symbols are the best for a production process designing. The entire Value Stream Mapping method uses a graphical representation of the manufacturing process, factors' pros and cons, that all stakeholders can easily understand. Value Stream Mapping is a graphical technique that provides possibilities to improve analysis of a manufacturing process, at the stage of the transferring information or materials that required to deliver a product or service to the customer.

TQM Diagram — Professional Total Quality Management

The Total Quality Management Diagram solution helps you and your organization visualize business and industrial processes. Create Total Quality Management diagrams for business process with ConceptDraw software.

Total Quality Management Value

The Total Quality Management Diagram solution helps you and your organization visualize business and industrial processes. Create Total Quality Management diagrams for business process with ConceptDraw software.
The vector stencils library "HR department" contains 50 workflow symbols.
Use this department icon set to draw your HR process flowcharts, workflow diagrams and infographics with the ConceptDraw PRO diagramming and vector drawing software.
The HR pictograms library "HR department" is included in the HR Flowcharts solution from the Management area of ConceptDraw Solution Park.
Accounting
Accounting, accounting,
Accounts payable
Accounts payable, accounts payable,
Accounts receivable
Accounts receivable,
Audit
Audit, audit,
Bank
Bank, bank,
Board of directors
Board of directors, board of directors,
Career center
Career center, career center,
Copy center
Copy center, copy center,
Customer service operator
Customer service operator, customer service operator,
Customer service technician
Customer service technician, customer service technician,
Data center
Data center, data center,
Delivery
Delivery, Delivery,
Design
Design, design,
Devices management
Devices management, devices management,
Distribution
Distribution, distribution,
Distribution 2
Distribution 2, distribution,
Employee
Employee, employee,
Engineering
Engineering, engineering,
Facilities
Facilities, facilities,
Finance
Finance, finance,
Human resource
Human resource, Human resource,
Information services
Information services, information services,
Information systems
Information systems, information systems,
International division
International division, international division,
International marketing
International marketing, international marketing,
International sales
International sales, international sales,
Inventory
Inventory, inventory,
Legal department
Legal department, legal department,
Mail room
Mail room, mail room,
Mail service
Mail service, mail service,
Management
Management, management,
Manufacturing
Manufacturing, manufacturing,
Marketing
Marketing, marketing,
Motorpool
Motorpool, motorpool,
Online service
Online service, online service,
Packaging
Packaging, packaging,
Payroll
Payroll, payroll,
Publications
Publications, publications,
Purchasing
Purchasing, purchasing,
Quality assurance
Quality assurance, quality assurance,
Receiving
Receiving, receiving, employee,
Reception
Reception, reception,
Research and development
Research and development, research and development,
Scales
Scales, scales,
Sales growth
Sales growth, sales growth,
Security
Security, security,
Shipping
Shipping, shipping,
Suppliers
Suppliers, suppliers,
Telecommunication
Telecommunication, telecommunication,
Warehouse
Warehouse, warehouse,

Workflow Diagram Symbols

Workflow diagrams is the acknowledged method to draw processes which have concerted set of symbols you use for depicting different kind of steps or relations. Often it named the process flow diagram but the real process flow diagram use differen visual notations and use different flowchart symbols. The professional workflow diagram also may be used for the same purpose as critical process flow diagram. Nevertheless, there are lots of cases you may need make your workflow diagram more bright and graphic. ConceptDraw PRO extended with the Workflow Diagram solution delivers rich set of workflow diagram symbols helps you make your workflow better-suited for presentations.

Value Stream Analysis

ConceptDraw Value Stream Maps are used in lean practice for analysis of manufacturing processes to identify the improvement opportunities.

Types of Flowcharts

A Flowchart is a graphically representation of the process, algorithm or the step-by-step solution of the problem. There are ten types of Flowcharts. Using the Flowcharts solution from the Diagrams area of ConceptDraw Solution Park you can easy and quickly design the Flowchart of any of these types.
How to Simplify Flow Charting

ERD Symbols and Meanings

Crow's foot notation is used in Barker's Notation, Structured Systems Analysis and Design Method (SSADM) and information engineering. Crow's foot diagrams represent entities as boxes, and relationships as lines between the boxes. Different shapes at the ends of these lines represent the cardinality of the relationship.
The Chen's ERD notation is still used and is considered to present a more detailed way of representing entities and relationships.
To create an ERD, software engineers mainly turn to dedicated drawing software, which contain the full notation resources for their specific database design - ERD symbols and meanings. CS Odessa has released an all-inclusive Entity-Relationship Diagram (ERD) solution for their powerful drawing program, ConceptDraw PRO.
How to Build an Entity Relationship Diagram (ERD)

Sales Process Flowchart Symbols

The most easier way of creating the visually engaging and informative Sales Process Flowchart is to create the new ConceptDraw document and to use the predesigned vector symbols offered in 6 libraries of the Sales Flowchart Solution. There are more than six types of sales process flow diagrams, ConceptDraw PRO software is flowchart maker which include six collections of extended flowchart symbols for effective diagramming. There are main collections of color coded flowchart symbols: Sales Department, Sales Steps, Sales Workflow, Sales Symbols and special set of Sales Arrows and Sales Flowchart.
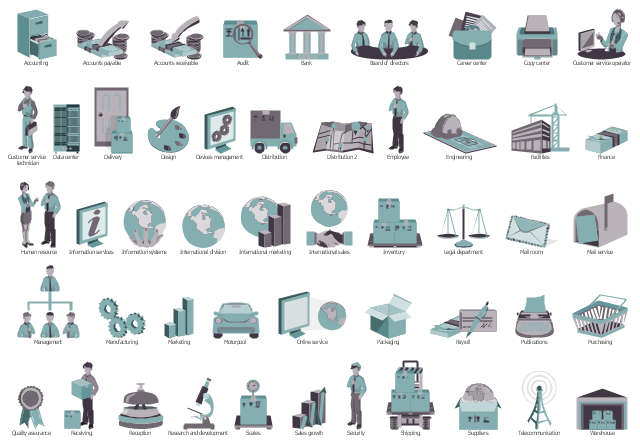
The vector stencils library "HR department" contains 49 department symbols.
Use it to design your HR flowcharts, workflow diagrams and process charts by the ConceptDraw PRO diagramming and vector drawing software.
"Functional departmentalization - Grouping activities by functions performed. Activities can be grouped according to function (work being done) to pursue economies of scale by placing employees with shared skills and knowledge into departments for example human resources, IT, accounting, manufacturing, logistics, and engineering. Functional departmentalization can be used in all types of organizations." [Departmentalization. Wikipedia]
The shapes example "Design elements - HR department" is included in the HR Flowcharts solution from the Management area of ConceptDraw Solution Park.
Department symbols for HR workflow diagrams
Department symbols for HR workflow diagrams, warehouse, telecommunication, suppliers, shipping, security, scales, sales growth, research and development, reception, receiving, quality assurance, purchasing, publications, payroll, packaging, online service, motorpool, marketing, manufacturing, management, mail service, mail room, legal department, inventory, international sales, international marketing, international division, information systems, information services, finance, facilities, engineering, employee, distribution, devices management, design, data center, customer service technician, customer service operator, copy center, career center, board of directors, bank, audit, accounts payable, accounting, Human resource, Delivery,