Venn Diagram Examples for Problem Solving. Environmental Social Science. Human Sustainability Confluence

SWOT analysis Software & Template for Macintosh and Windows

"SWOT Analysis.
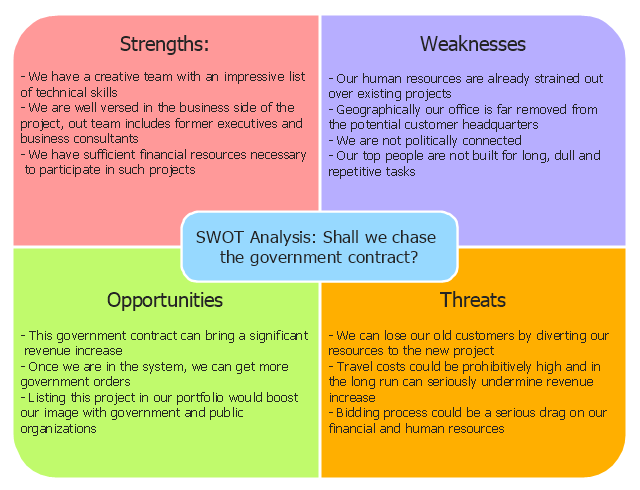
A tool that identifies the strengths, weaknesses, opportunities and threats of an organization. Specifically, SWOT is a basic, straightforward model that assesses what an organization can and cannot do as well as its potential opportunities and threats. The method of SWOT analysis is to take the information from an environmental analysis and separate it into internal (strengths and weaknesses) and external issues (opportunities and threats). Once this is completed, SWOT analysis determines what may assist the firm in accomplishing its objectives, and what obstacles must be overcome or minimized to achieve desired results." [investopedia.com/ terms/ s/ swot.asp]
The SWOT matrix example "Government contract" was created using the ConceptDraw PRO diagramming and vector drawing software extended with the SWOT Analysis solution from the Management area of ConceptDraw Solution Park.
SWOT
Using Fishbone Diagrams for Problem Solving

Simple Drawing Applications for Mac

Software for Creating SWOT Analysis Diagrams

PROBLEM ANALYSIS. Root Cause Analysis Tree Diagram


Cause and Effect Analysis - Fishbone Diagrams for Problem Solving

Competitor Analysis

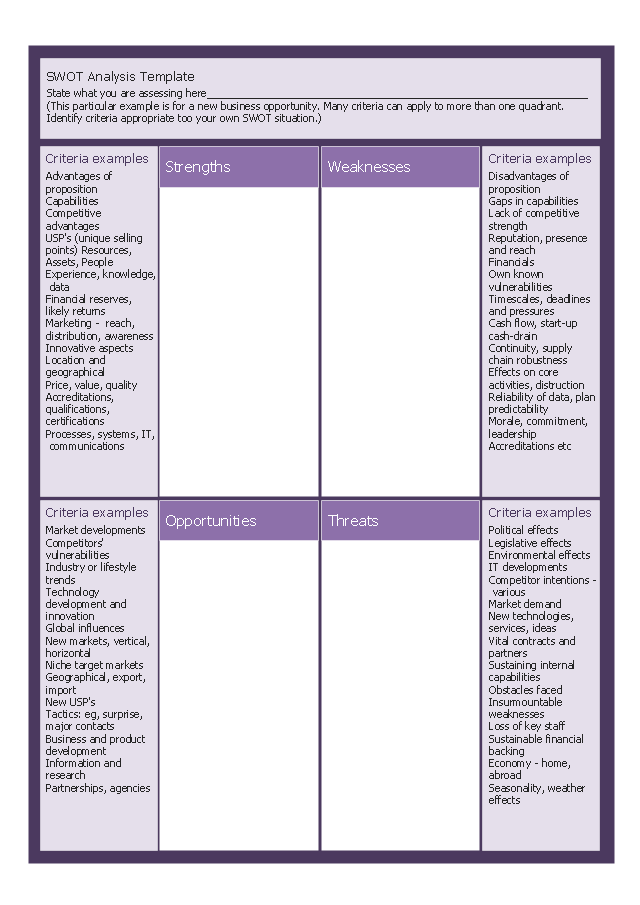
"A SWOT analysis is a subjective method used to evaluate the STRENGTHS, WEAKNESSES, OPPORTUNITIES, and THREATS involved in trying to attain an objective. It involves specifying the objective and identifying the internal and external factors that are favourable and unfavourable to achieving the objective. It can be used as a business tool or on a personal level where it can help you take advantage of your talents, abilities and opportunities. It can help to clarify and summarise the key issues and opportunities facing you and thereby to set objectives and develop new strategies. It should help you to to maximise strengths and minimise weaknesses in order to take advantage of opportunities and reduce threats." [kent.ac.uk/ careers/ sk/ decisionmaking.htm]
This form template "New business opportunity SWOT analysis matrix" for the ConceptDraw PRO diagramming and vector drawing software is included in the SWOT Analysis solution from the Management area of ConceptDraw Solution Park.
This form template "New business opportunity SWOT analysis matrix" for the ConceptDraw PRO diagramming and vector drawing software is included in the SWOT Analysis solution from the Management area of ConceptDraw Solution Park.
SWOT matrix template
Fishbone Diagram Template

Cross-Functional Flowchart


Positioning Map

Quality visualization in your company

How Do Fishbone Diagrams Solve Manufacturing Problems

- Life cycle analysis - Ring chart | SWOT matrix - Government contract ...
- SWOT Matrix Template | Swot Analysis Examples | SWOT Analysis ...
- Environmental Swot Analysis
- SWOT Analysis | Corrective Action Planning | The Action Plan ...
- SWOT Analysis | Competitor Analysis | What is SWOT Analysis ...
- SWOT Analysis | Marketing Analysis Diagram | SWOT and TOWS ...
- Swot Analysis For Graphic Designers
- Mind Maps for Business - SWOT Analysis | SWOT Analysis | The ...
- Venn Diagram Examples for Problem Solving. Environmental Social ...
- Authority Matrix Diagram Software | PROBLEM ANALYSIS ...
- TOWS Matrix | SWOT Analysis Solution - Strategy Tools | TOWS ...
- SWOT Analysis | SWOT analysis for a small independent bookstore ...
- SWOT Analysis | SWOT Matrix | Software for Creating SWOT ...
- SWOT Analysis
- Cause and Effect Analysis - Fishbone Diagrams for Problem Solving ...
- SWOT Analysis | SWOT analysis for a small independent bookstore ...
- Software for Creating SWOT Analysis Diagrams | SWOT Matrix ...
- SWOT Analysis | SWOT Matrix Template | Software for Creating ...
- SWOT Analysis | Swot Analysis Examples for Mac OSX | SWOT ...
- Software for Creating SWOT Analysis Diagrams | Marketing Analysis ...