Venn Diagram Examples for Problem Solving. Environmental Social Science. Human Sustainability Confluence

This cycle diagram sample was created on the base of the figure illustrating the article "Environmental Materials" by Cris Arnold from the website of the UK Centre for Materials Education of the Higher Education Academy. "The figure ... schematically shows how the disparate areas under the heading of 'environmental materials' can be linked via a life cycle analysis approach. ...
Life Cycle Analysis.
Life Cycle Analysis is essentially a method of considering the entire environmental impact, energy and resource usage of a material or product. It is often known as a 'cradle-to-grave' analysis and can encompass the entire lifetime from extraction to end-of-life disposal. Life cycle analysis can be an extremely effective way of linking many different aspects of the environmental impacts of materials usage. ...
Materials Extraction and Resource Implications.
The environmental impact of raw materials extraction and processing together with global resource issues provides a good place to start consideration of environmental aspects of materials. ...
Environmental Impacts of Processing.
... Topics that would come under this subject area include the specific environmental problems associated with processing of metals, polymers, ceramics, composites etc, and how these problems can be overcome.
Design for Sustainability.
This area ... will ... cover issues such as design for successful recycling, waste minimisation, energy efficiency and increased lifetime.
Economic, Social and Legislative Issues.
... For example, materials selection within the automotive industry is now heavily influenced by 'end-of-life vehicle' and 'hazardous material' regulations.
Use of Sustainable Materials.
... It is probably sensible to define such materials as those that have distinct differences that achieve environmental benefit compared to conventional materials. With this definition, the list would include:
(1) Materials of a significantly plant-based nature, including wood, natural fibre composites, natural polymers.
(2) Materials produced using a large proportion of waste material, including recycled polymers, composites made from waste mineral powders, and arguably also much steel and aluminium.
Materials for Green Energy.
The most exciting developments in Materials Science are in the realm of functional materials, and many of these serve an environmentally-beneficial purpose, particularly in the production of green energy.
These include:
(1) Solar-cell materials.
(2) Fuel-cell technology.
(3) Catalytic pollution control.
End-of-Life Issues.
The treatment of materials at the end of their lifetime is a significant subject area and encompasses aspects such as recycling techniques and materials limitations, biodegradabilty and composting, chemical recovery and energy recovery." [materials.ac.uk/ guides/ environmental.asp]
The ring chart example "Life cycle analysis" was created using the ConceptDraw PRO diagramming and vector drawing software extended with the Target and Circular Diagrams solution from the Marketing area of ConceptDraw Solution Park.
www.conceptdraw.com/ solution-park/ marketing-target-and-circular-diagrams
Ring chart

Geo Map — USA — Florida

Fishbone Problem Solving

PROBLEM ANALYSIS. Root Cause Analysis Tree Diagram


Pyramid Diagram

Simple Drawing Applications for Mac

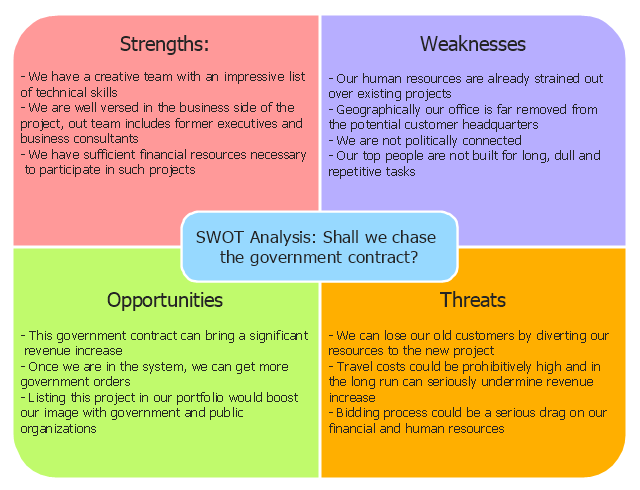
"SWOT Analysis.
A tool that identifies the strengths, weaknesses, opportunities and threats of an organization. Specifically, SWOT is a basic, straightforward model that assesses what an organization can and cannot do as well as its potential opportunities and threats. The method of SWOT analysis is to take the information from an environmental analysis and separate it into internal (strengths and weaknesses) and external issues (opportunities and threats). Once this is completed, SWOT analysis determines what may assist the firm in accomplishing its objectives, and what obstacles must be overcome or minimized to achieve desired results." [investopedia.com/ terms/ s/ swot.asp]
The SWOT matrix example "Government contract" was created using the ConceptDraw PRO diagramming and vector drawing software extended with the SWOT Analysis solution from the Management area of ConceptDraw Solution Park.
SWOT
Cross-Functional Flowchart


Competitor Analysis

Building Drawing Software for Design Registers, Drills and Diffusers


Types of Flowchart - Overview


 Fishbone Diagrams
The Fishbone Diagrams solution extends ConceptDraw PRO v10 software with the ability to easily draw the Fishbone Diagrams (Ishikawa Diagrams) to clearly see the cause and effect analysis and also problem solving. The vector graphic diagrams produced using this solution can be used in whitepapers, presentations, datasheets, posters, and published technical material.
 HVAC Plans
Use HVAC Plans solution to create professional, clear and vivid HVAC-systems design plans, which represent effectively your HVAC marketing plan ideas, develop plans for modern ventilation units, central air heaters, to display the refrigeration systems for automated buildings control, environmental control, and energy systems.
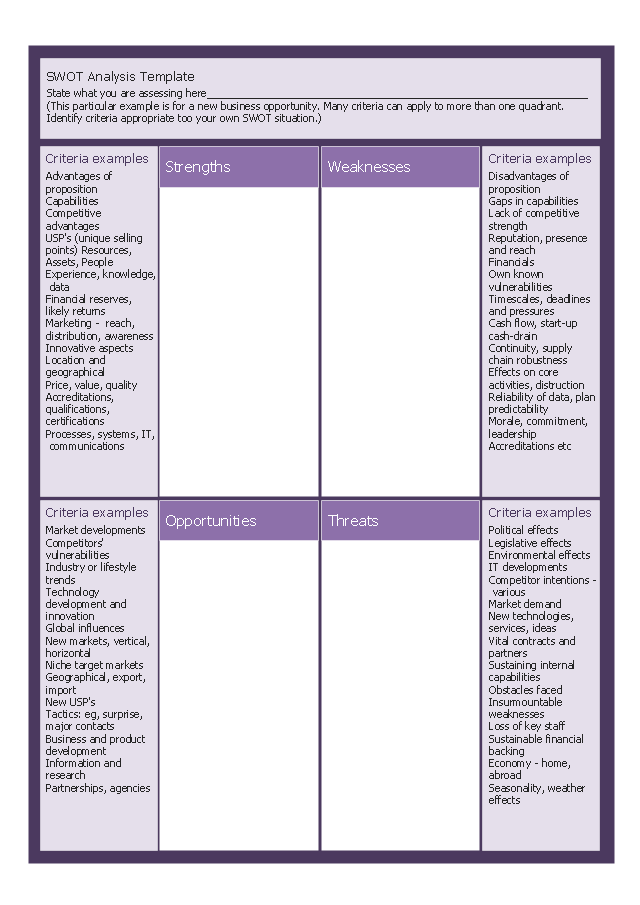
"A SWOT analysis is a subjective method used to evaluate the STRENGTHS, WEAKNESSES, OPPORTUNITIES, and THREATS involved in trying to attain an objective. It involves specifying the objective and identifying the internal and external factors that are favourable and unfavourable to achieving the objective. It can be used as a business tool or on a personal level where it can help you take advantage of your talents, abilities and opportunities. It can help to clarify and summarise the key issues and opportunities facing you and thereby to set objectives and develop new strategies. It should help you to to maximise strengths and minimise weaknesses in order to take advantage of opportunities and reduce threats." [kent.ac.uk/ careers/ sk/ decisionmaking.htm]
This form template "New business opportunity SWOT analysis matrix" for the ConceptDraw PRO diagramming and vector drawing software is included in the SWOT Analysis solution from the Management area of ConceptDraw Solution Park.
This form template "New business opportunity SWOT analysis matrix" for the ConceptDraw PRO diagramming and vector drawing software is included in the SWOT Analysis solution from the Management area of ConceptDraw Solution Park.
SWOT matrix template
- Venn Diagram Examples for Problem Solving. Environmental Social ...
- Tree Diagram Of Environmental Problem
- Diagram Of The Problem Of Environmental Tree
- Venn Diagram Examples for Problem Solving. Environmental Social ...
- Examples For Environment On Cause And Effect Diagram
- Competitor Analysis | Life cycle analysis - Ring chart | Pie Charts ...
- Fishbone Diagram Problem Solving | Using Fishbone Diagrams for ...
- Fishbone Diagram Problem Solving | Using Fishbone Diagrams for ...
- Basic Flowchart Symbols and Meaning | Venn Diagram Examples ...
- Pie Charts | Logistics Flow Charts | How to Create a Pie Chart ...
- Energy resources diagram | Resources and energy - Vector stencils ...
- Energy Pyramid Diagram | Energy resources diagram | Resources ...
- Flowchart Example: Flow Chart of Marketing Analysis | Competitor ...
- Energy resources diagram | U.S. energy consumption by source ...
- Draw Flowcharts with ConceptDraw | Steps of Accounting Cycle ...
- Resources and energy - Vector stencils library | Energy resources ...
- Environmental Swot Analysis
- BPR Diagram. Business Process Reengineering Example | Circular ...
- National Preparedness Cycle - Arrow ring chart | Program to Make ...