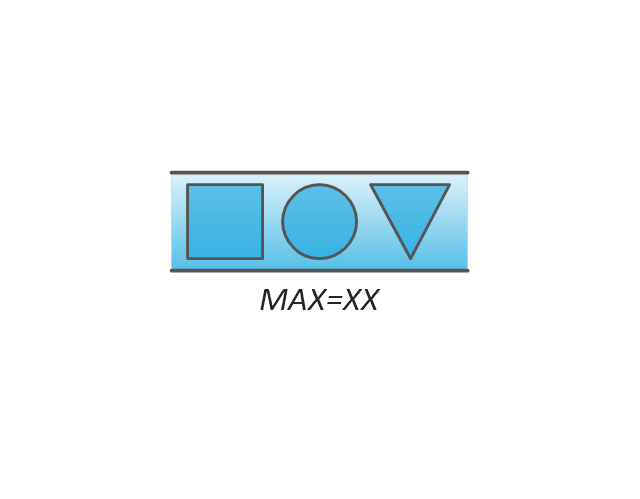
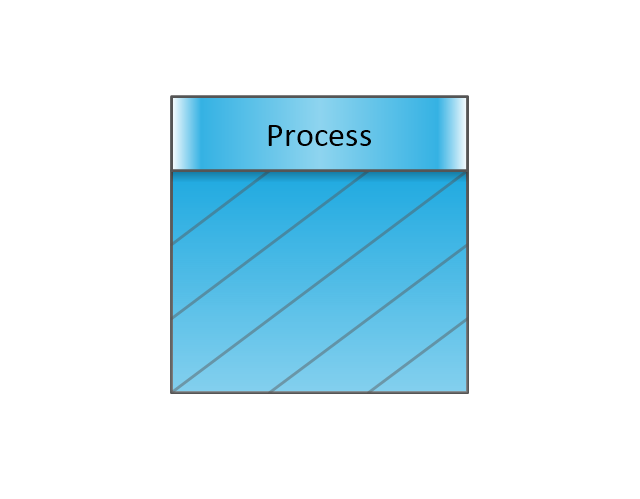
 Jackson Structured Programming (JSP) Diagrams
The Jackson Structured Programming (JSP) Diagram solution extends the functionality and drawing abilities of the ConceptDraw DIAGRAM software with set of illustrative JSP diagrams samples and large variety of predesigned vector objects of actions, processes, procedures, selection, iteration, as well as arrows and connectors to join the objects during Jackson structured development and designing Jackson structured programming diagrams, JSP diagram, Jackson structure diagram (JSD), Program structure diagram. The powerful abilities of this solution make the ConceptDraw DIAGRAM ideal assistant for programmers, software developers, structural programmers, computer engineers, applications constructors, designers, specialists in structured programming and Jackson systems design, and other technical, computer and software specialists.
Six Markets Model Chart

The vector stencils library "Value stream mapping" contains 43 VSM symbols.
Use it for drawing value stream maps in the ConceptDraw PRO diagramming and vector drawing software extended with the Value Stream Mapping solution from the Quality area of ConceptDraw Solution Park.
www.conceptdraw.com/ solution-park/ business-value-stream-mapping
Use it for drawing value stream maps in the ConceptDraw PRO diagramming and vector drawing software extended with the Value Stream Mapping solution from the Quality area of ConceptDraw Solution Park.
www.conceptdraw.com/ solution-park/ business-value-stream-mapping
Inventory

Inventory

Information Flow

Shipment

Shipment

Material Flow

Material Pull

FIFO Line
Truck shipment/Logistics

Customer/Supplier

Dedicated Process

Shared Process
Supermarket Parts

Data Box
Workcell

Kaizen Burst

Operator

Other
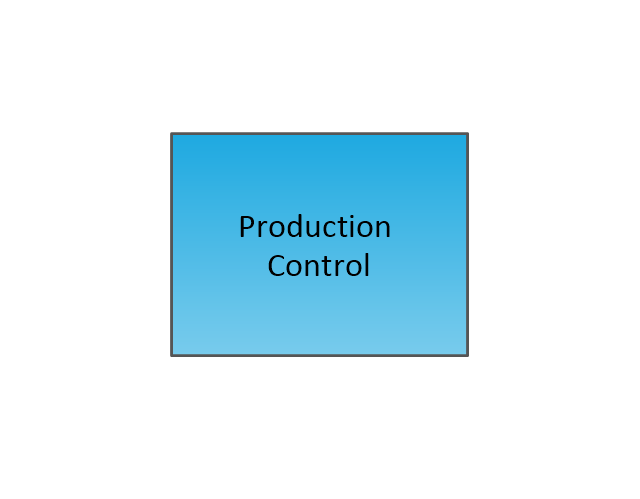
Production Control
Manual Info

Electronic Information Flow

Production Kanban

Withdrawal Kanban

Signal Kanban
Kanban Post

Sequenced Pull

Load Levelling

MRP/ERP

Go-See

Pull Arrow
Manual Info

Pull Arrow
Timeline Total
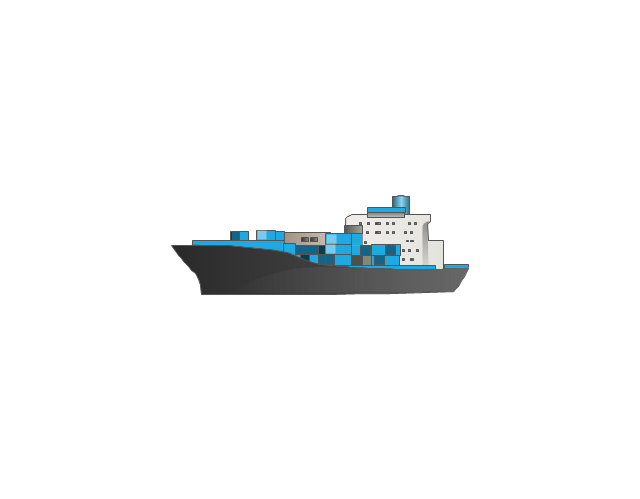
Ship
Forklift Truck

Plane

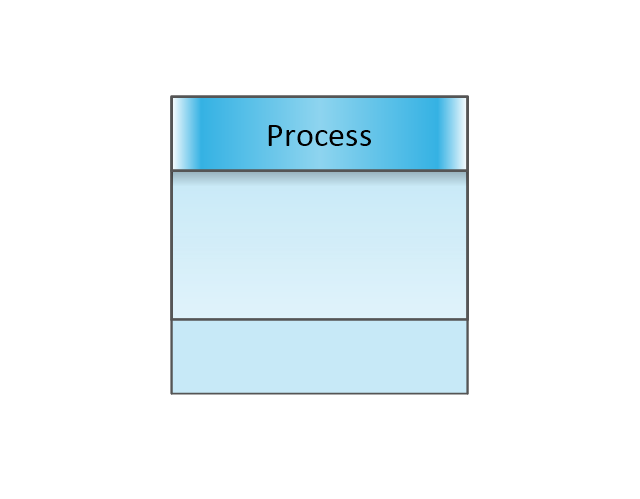
Process with Data
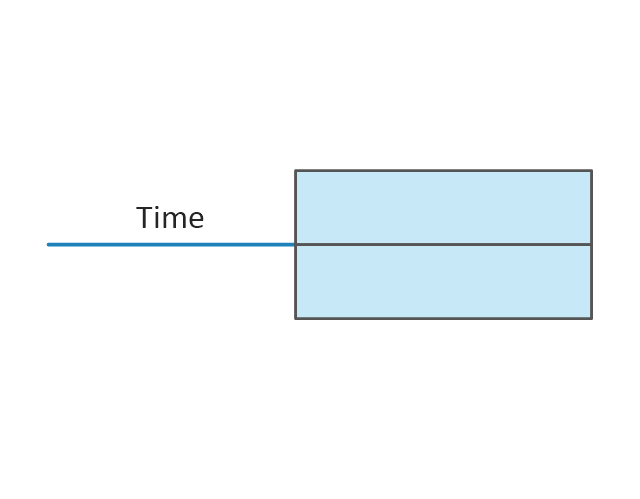
Timeline
Timeline

Supermarket, 2

Supermarket, 3

Safety stock, 2

Safety stock, 3

The vector stencils library "Transport map" contains 96 pictograms for drawing transport maps.
Use it in your spatial infographics for visual representation of transport schemes and plans as metro maps in the ConceptDraw PRO diagramming and vector drawing software extended with the Spatial Infographics solution from the area "What is Infographics" of ConceptDraw Solution Park.
Use it in your spatial infographics for visual representation of transport schemes and plans as metro maps in the ConceptDraw PRO diagramming and vector drawing software extended with the Spatial Infographics solution from the area "What is Infographics" of ConceptDraw Solution Park.
Train Railway

Bus Stop

Tramlink

Marina/Ferry Dock

Information Center

Information Center

Airport

Airport

Underground/Subway/Metro

Underground/Subway/Metro

National Rail Train Station

Taxi

Taxi

Parking

Parking

Parking

Parking

Bicycle Parking

Bicycle Parking

Fuel/Gas/Petrol

Fuel/Gas/Petrol

Police

Police

Hospital

Hospital

Wheelchair Access

Wheelchair Access

First Aid

First Aid

Telephone

Telephone

Post Office

Post Office

Landmarks and Museums

Landmarks and Museums

University

University

Shopping/Supermarket

Shopping/Supermarket

Cafe

Cafe

Food and Drinks

Food and Drinks

Man

Woman

Restrooms/Toilets

Restrooms/Toilets

Park

Park

Zoo

Zoo

Hotel

Hotel

Camping

Camping

City

Skyscraper

Building

Ocean

Straight River

Flexible River

Bridge

North Arrow
Viewpoint

Scale

Road line

Road rounded line

Road corner

Road curve 1

Road curve 2

Crossroads

Roundabout

Cloverleaf interchange

Roadway break

Railway line

Railway curve

Railway fork

Standard line with standard station - basic road

Thick line with standard station - basic road

Standard line with rectangular station - basic road

Thick line with rectangular station - basic road

Standard line with standard station - double road

Thick line with standard station - double road

Standard line with rectangular station - double road

Thick line with rectangular station - double road

Standard line with standard station - dotted road

Thick line with standard station - dotted road

Standard line with rectangular station - dotted road

Thick line with rectangular station - dotted road

Interchange Station Vertical

Interchange Station Horizontal

Transfer Station 1

Transfer Station 2

Transfer Station 3

Line Notation

Street direction

Business Diagram Software


 Site Plans
The Site Plans solution extends ConceptDraw DIAGRAM with samples, templates and numerous libraries of design elements making it powerful site plan software, ideal for landscape drawing, designing Site Plans, Site Layout Plans, Landscape Design Drawings, Home Site Plans, Hotel Site Plans, Park Site Plans, for developing the residential and commercial landscape design drawings and site plan, parks planning, landscaping territories, lighting trails, for creating drainage facilities, yard layouts, plant maps, outdoor recreational facilities, and irrigation systems plans.
 Food Court
Use the Food Court solution to create food art. Pictures of food can be designed using libraries of food images, fruit art and pictures of vegetables.
Marketing Organization Chart

 Pyramid Diagrams
Pyramid Diagrams solution extends ConceptDraw DIAGRAM software with templates, samples and library of vector stencils for drawing the marketing pyramid diagrams.
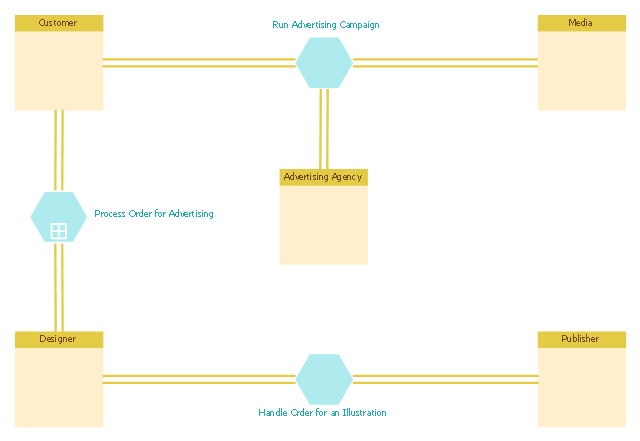
This BPMN (Business Process Model and Notation) diagram sample shows the advertising creation process workflow.
"Types of advertising.
Virtually any medium can be used for advertising. Commercial advertising media can include wall paintings, billboards, street furniture components, printed flyers and rack cards, radio, cinema and television adverts, web banners, mobile telephone screens, shopping carts, web popups, skywriting, bus stop benches, human billboards and forehead advertising, magazines, newspapers, town criers, sides of buses, banners attached to or sides of airplanes ("logojets"), in-flight advertisements on seatback tray tables or overhead storage bins, taxicab doors, roof mounts and passenger screens, musical stage shows, subway platforms and trains, elastic bands on disposable diapers, doors of bathroom stalls, stickers on apples in supermarkets, shopping cart handles (grabertising), the opening section of streaming audio and video, posters, and the backs of event tickets and supermarket receipts. Any place an "identified" sponsor pays to deliver their message through a medium is advertising." [Advertising. Wikipedia]
The business process modeling diagram example "Advertising creation process - Conversation BPMN 2.0 diagram" was designed using the ConceptDraw PRO diagramming and vector drawing software extended with the Business Process Diagram solution from the Business Processes area of ConceptDraw Solution Park.
Business process modeling
Data modeling with ConceptDraw DIAGRAM

Business Process Workflow Diagram


Pyramid Diagram and Pyramid Chart

Process Flowchart


Organization Structure

 Business Diagrams
The Business Diagrams Solution extends ConceptDraw DIAGRAM with an extensive collection of professionally designed illustrative samples and a wide variety of vector stencils libraries, which are the real help for all business-related people, business analysts, business managers, business advisers, marketing experts, PR managers, knowledge workers, scientists, and other stakeholders allowing them to design the bright, neat, expressive and attractive Bubble Diagrams, Circle-Spoke Diagrams, Circular Arrows Diagrams, and Venn Diagrams with different quantity of sets in just minutes; and then successfully use them in documents, reports, statistical summaries, and presentations of any style.
ConceptDraw Arrows10 Technology

Integration Definition

Pyramid Diagram

- Er Diagram For Supermarket Database
- Entity Relatioship Diagram For Online Supermarket System
- Erd Diagram For Supermarket
- Process Flowchart | TQM Diagram Tool | Erd For Supermarket System
- Process Flowchart | Schema And Er Diagram Of Supermarket ...
- Food Court | Winter Sports | Bubble Diagrams | Erd On Super Store ...
- Er Diagram Examples For Supermarket
- Er Diagram Of Supermarket Management System
- Er Diagram Example Online Supermarket Entity Attributes
- Attributes In Er Diagram For Supermarket Management System
- Enterprise Architecture Diagrams | Online Grocery Erd Diagram
- Draw Network Diagram based on Templates and Examples ...
- Er Diagram For Supermarket Management
- Project In Er Diagram Fir Supermarket Management System In Pdf
- Entity-Relationship Diagram ( ERD ) | Er Diagram For Shop ...
- Process Flowchart | Site Plans | Supermarket Entity Er Diagram
- Er Diagram For Supermarket Management System
- Food Management Erd Diagram Pdf
- Supermarket Layout Design Software
- Uml Diagrams For Supermarket Management System