Map Infographic Design

 Spatial Infographics
Spatial infographics solution extends ConceptDraw PRO software with infographic samples, map templates and vector stencils libraries with design elements for drawing spatial information graphics.
Map Infographic Tool

Best Tool for Infographic Construction

Map Infographic Maker

Spatial infographics Design Elements: Location Map

How to Create a Powerful Infographic When You do not Have a Designer

HelpDesk
How to Create Infographics Using the Spatial Infographics Solution

Visualization Spatial Data Using Thematic Maps Combined with Infographics

Nice and simple, but the features it have are power-packed!
Spatial Infographics

How tо Represent Information Graphically

Tools for Creating Infographics and Visualizations

Transportation Infographics

Infographics and Maps

Tools to Create Your Own Infographics

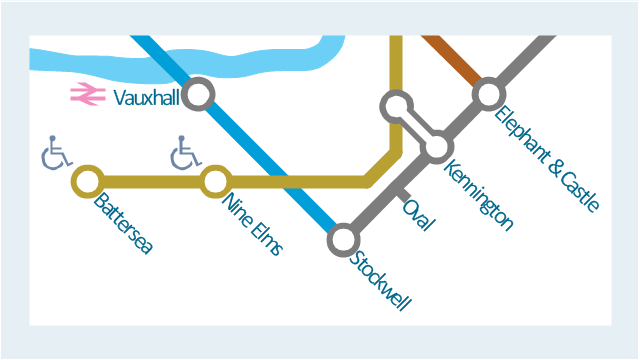
This spatial infographic example was created on the base of the tube map from the Transport for London website.
[tfl.gov.uk/ assets/ images/ general/ 24746-nle-gallery-tube-map.jpg]
"The Tube map is a schematic transit map of the lines and stations of London's public rapid transit railway systems, namely the London Underground (commonly known as the Tube, hence the name), Docklands Light Railway, London Overground and Emirates Air Line, as well as being incorporated into Greater London connections maps.
As a schematic diagram, it shows not necessarily the geographic but rather the relative positions of stations along the lines, stations' connective relations with each other and fare zones. The basic design concepts have been widely adopted for other network maps around the world, especially that of mapping topologically rather than geographically." [Tube map. Wikipedia]
The spatial infographics example "Metro map - Northern line extension to Battersea via Nine Elms" was created using the ConceptDraw PRO diagramming and vector drawing software extended with the Spatial Infographics solution from the area "What is Infographics" of ConceptDraw Solution Park.
Tube map
Winter Sports Vector Clipart. Medal Map. Spatial Infographics

 What are Infographic Area
Solutions of the area What is Infographics from ConceptDraw Solution Park collect templates, samples and vector stencils libraries with design elements for the drawing information graphics.
HelpDesk
How to Make a Web Page from Infographics in ConceptDraw PRO

- Spatial Infographics | Map Infographic Design | Spatial infographics ...
- Spatial Infographics | Map Infographic Maker | Spatial Infographics |
- Spatial Infographics
- Map Infographic Creator | Spatial infographics Design Elements ...
- Map Infographic Creator | Spatial infographics Design Elements ...
- Excellent Examples of Infographic Maps | Visualization Spatial Data ...
- Maps | Spatial Infographics | Map Infographic Creator |
- Transportation Infographics | Spatial infographics Design Elements ...
- Map Infographic Creator | Visualization Spatial Data Using Thematic ...
- Excellent Examples of Infographic Maps | Spatial Infographics | PM ...
- Map Infographic Creator | Spatial infographics Design Elements ...
- Subway infographic design elements - software tools ...
- Map Infographic Creator | Visualization Spatial Data Using Thematic ...
- Best Tool for Infographic Construction | Map Infographic Creator ...
- Spatial infographics Design Elements: Continental Map | Map ...
- Infographic software: the sample of New York City Subway map ...
- Map Infographic Creator | Visualization Spatial Data Using Thematic ...
- Best Tool for Infographic Construction | Spatial Infographics | What is ...
- Subway infographic design elements - software tools | Map ...
- What is Infographics Area | Map Infographic Maker | Visualization ...