SysML

SysML Diagram

Best Deck Design Software

ConceptDraw DIAGRAM DFD Software

Professional Deck Design Software

Examples of Flowcharts, Org Charts and More


How To Create Restaurant Floor Plan in Minutes


Diagramming Software for Design UML Object Diagrams


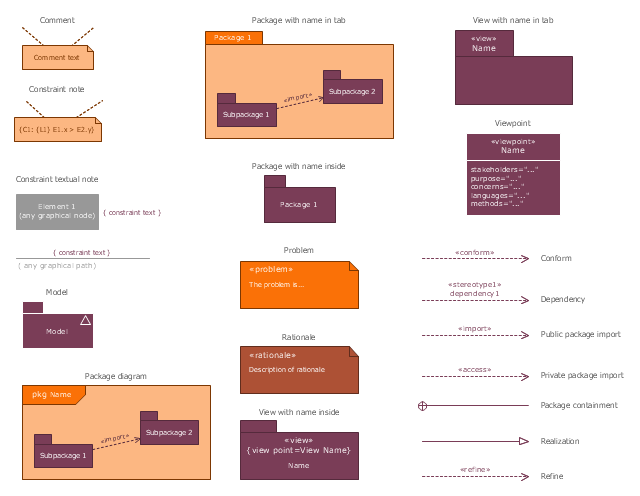
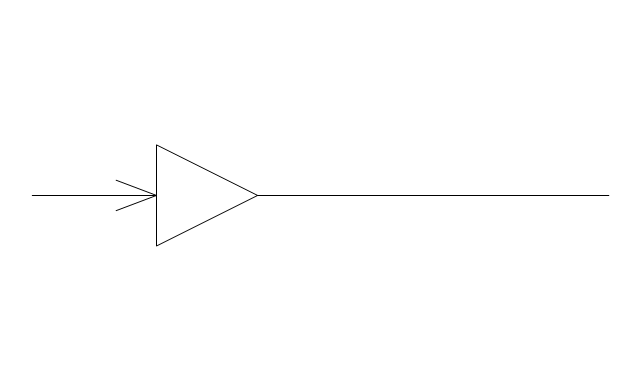
The vector stencils library "SysML diagrams" contains 19 symbols.
Use it to design your SysML diagrams using ConceptDraw PRO diagramming and vector drawing software.
"The Systems Modeling Language (SysML) is a general-purpose modeling language for systems engineering applications. It supports the specification, analysis, design, verification and validation of a broad range of systems and systems-of-systems.
SysML was originally developed by an open source specification project, and includes an open source license for distribution and use. SysML is defined as an extension of a subset of the Unified Modeling Language (UML) using UML's profile mechanism." [Systems Modeling Language. Wikipedia]
The building blocks example "Design elements - SysML diagrams" is included in the SysML solution from the Software Development area of ConceptDraw Solution Park.
SysML diagram building blocks
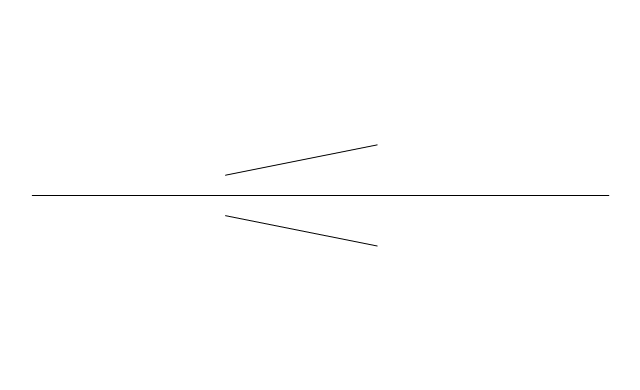
The vector stencils library "Cable TV" contains 64 symbols of cable TV network equipment.
Use these shapes for drawing CATV system design floor plans, network topology diagrams, wiring diagrams and cabling layout schemes in the ConceptDraw PRO diagramming and vector drawing software.
The vector stencils library "Cable TV" is included in the Electric and Telecom Plans solution from the Building Plans area of ConceptDraw Solution Park.
Output Directional Tap 1

Output Directional Tap 2

Output Directional Tap 3

Output Directional Tap 4

Output Directional Tap 5

2-way Splitter

3-way Splitter

4-way Splitter

AC Power Block

Bond

Down Guy

Building Guy and Anchor

Rock Guy with Anchor

Down Guy with Anchor

Pole-to-Pole Guy

Sidewalk Down Guy with Anchor

Sidewalk Down Guy

Slack Span Messenger Wire

Tensioned Messenger Wire w/out cable

Tensioned Messenger Wire

Ground

Joint Usage (Power & Telephone Pole)
-cable-tv---vector-stencils-library.png--diagram-flowchart-example.png)
Joint Usgae Pole with Transformer

Strut

Tree Guy with Anchor

Push Brace (smaller pole in actual relative position)
-cable-tv---vector-stencils-library.png--diagram-flowchart-example.png)
Extension Arm

Built CATV Pole

Proposed CATV Pole

Directional Tap 1

Directional Tap 2

Manhole

Telephone Pole

Riser Pole

Vault Handheld

Fixed Equalizer

Fixed Flat Attenuators

Other Supporting Structures

Pedestal - Underground Routing

Power Pole

Direct Buried Underground Routing

Duct Line Underground Routing

Line Terminations

2-Way Optical Splice Location

3-Way Optical Splice Location

4-Way Optical Splice Location

> 4-Way Optical Splice Location

Optical Amplifier

Cable AC Power Combiner

Optical Fiber Cable

Optical Connector

Wavelength Demultiplexer

Wavelength Multiplexer

Optical Transmitter

Optical Transmitter

Optical Node

Optical Splitter

Headend (Signal Processing)
-cable-tv---vector-stencils-library.png--diagram-flowchart-example.png)
Node

Primary Hub

Secondary Hub

Coaxial Splice

Power Supply

Variable Equalizer

Business Startup

Drawing a Nature Scene

Program Structure Diagram

Jacobson Use Cases Diagram

 EXPRESS-G data Modeling Diagram
EXPRESS-G data Modeling Diagram solution extends the ConceptDraw DIAGRAM software functionality with capabilities of EXPRESS data modeling language, includes powerful data modeling tools, Express-G diagram tool, database diagram tool, database design tool, wide variety of pre-made vector objects of EXPRESS-G notation and EXPRESS-G diagrams samples allowing software developers, software designers, software engineers and other stakeholders to make their data models for information systems, to develop the databases, to learn the principles of construction EXPRESS-G diagrams and helping to draw their own EXPRESS-G Data Modeling Diagrams, Express-G Diagrams or Database Model Diagram without any efforts.
 Computer and Networks Area
The solutions from Computer and Networks Area of ConceptDraw Solution Park collect samples, templates and vector stencils libraries for drawing computer and network diagrams, schemes and technical drawings.
Geo Map — Europe — Greece

Mind Map Food

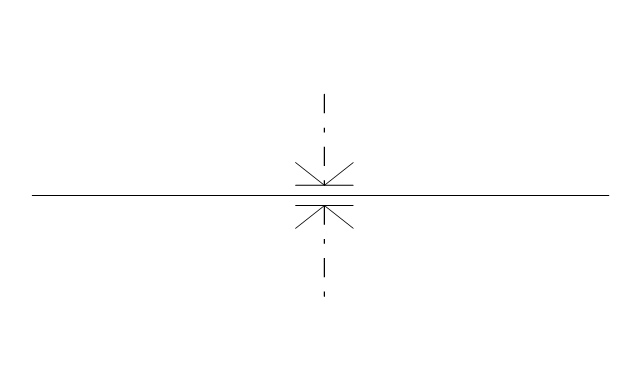
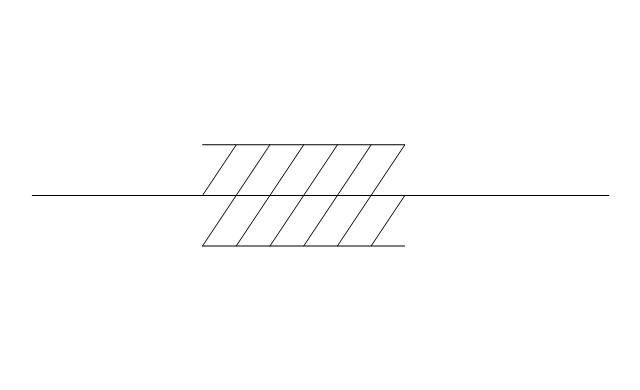
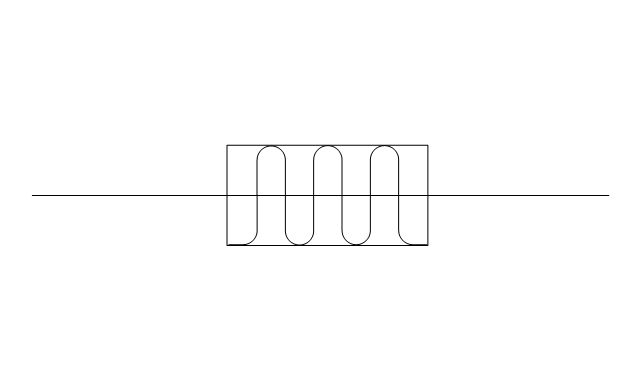
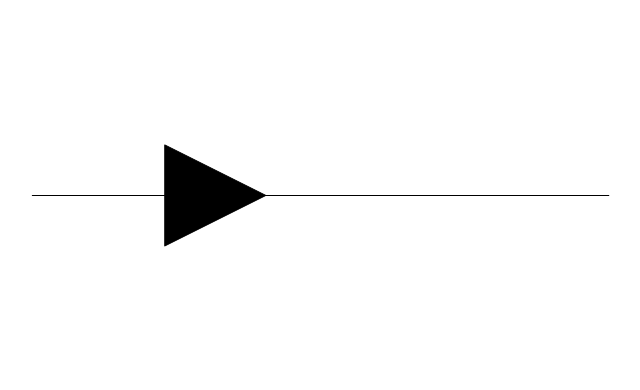
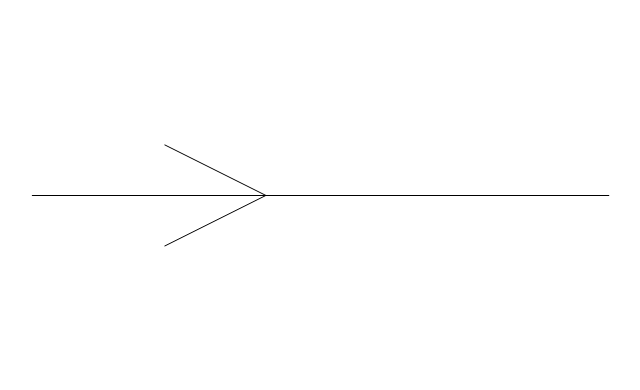
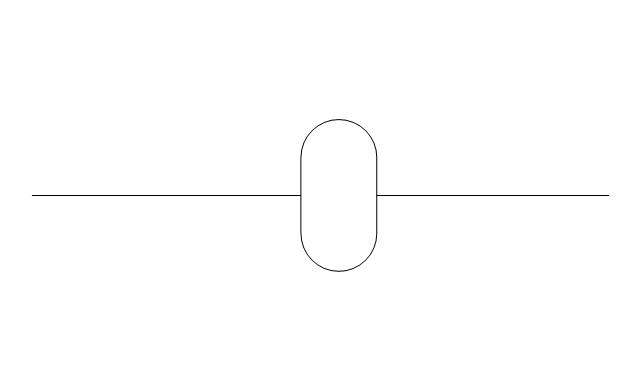
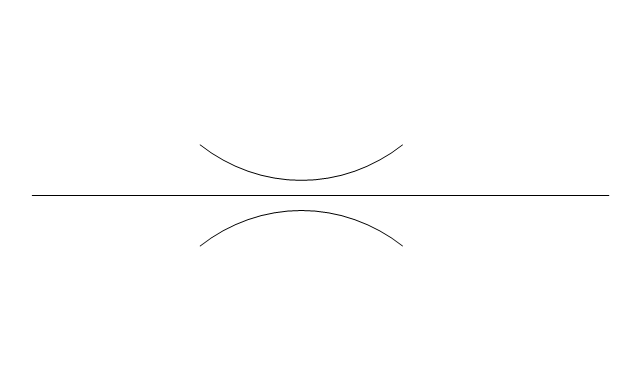
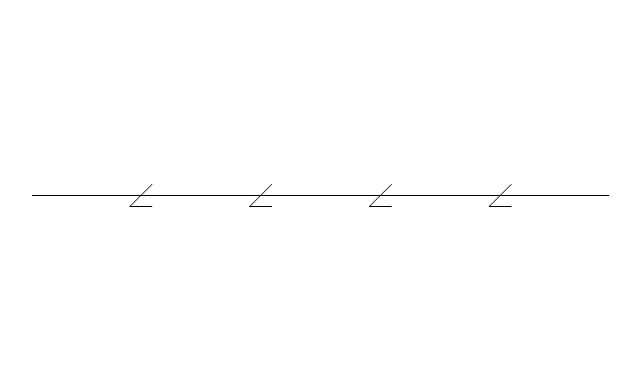
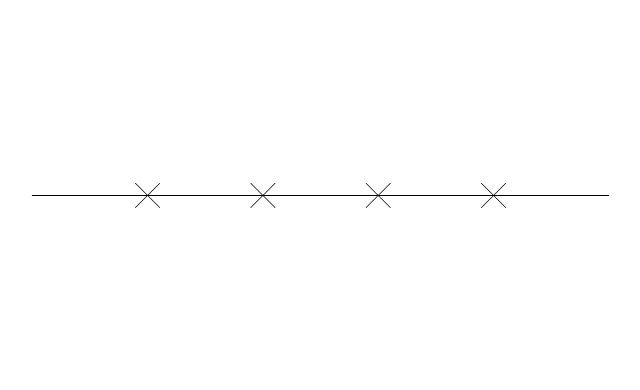
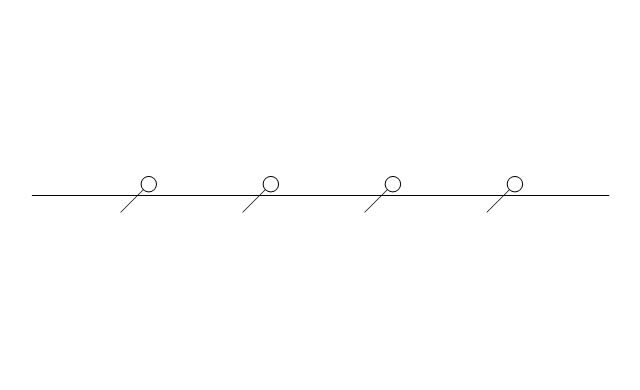
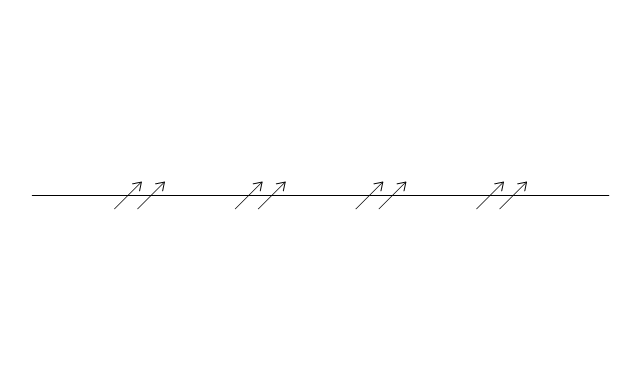
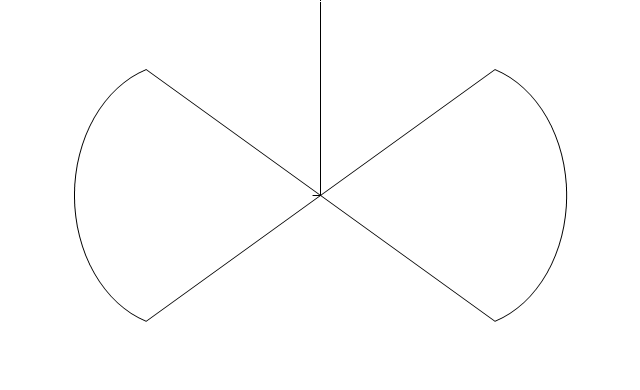
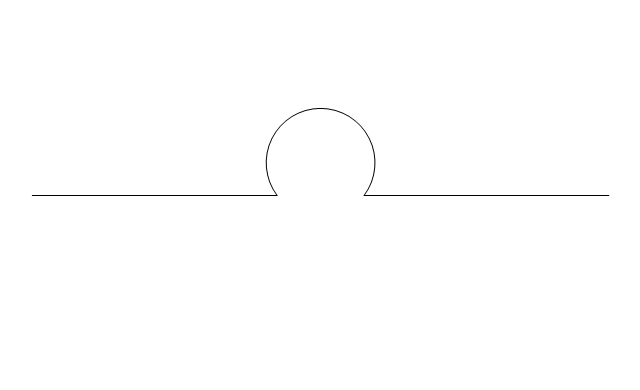
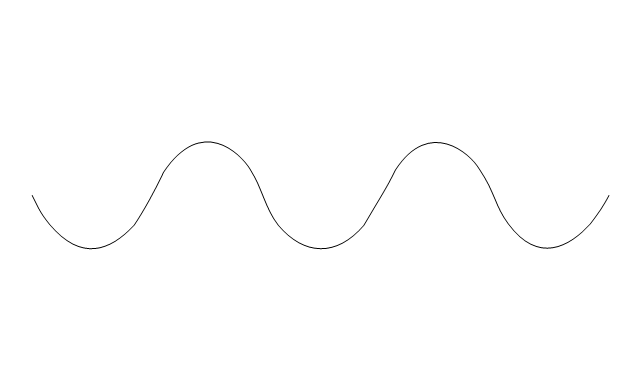
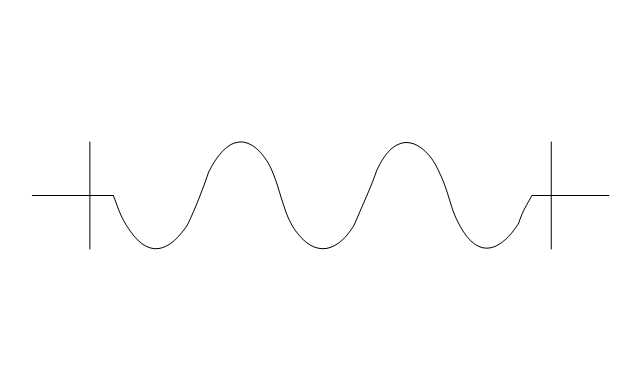
The vector stencils library "Pipes 2" contains 48 symbols of pipes. Use it for drawing plumbing and piping building plans, schematic diagrams, blueprints, or technical drawings of waste water disposal systems, hot and cold water supply systems in the ConceptDraw PRO diagramming and vector drawing software extended with the Plumbing and Piping Plans solution from the Building Plans area of ConceptDraw Solution Park.
Crossing
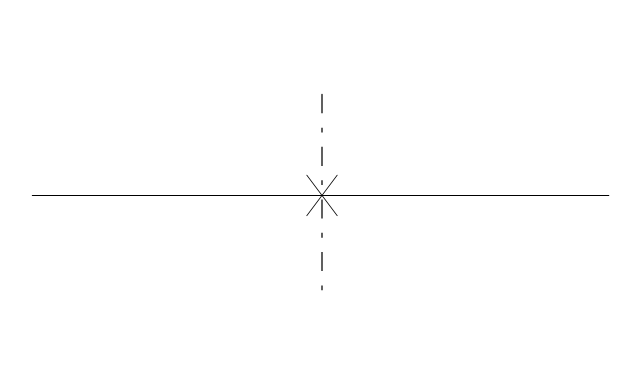
Junction

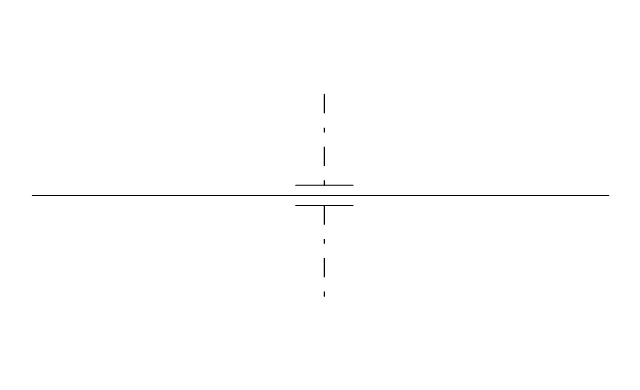
Basic support
Guide 1
Guide 2
Guide 3
Stopper
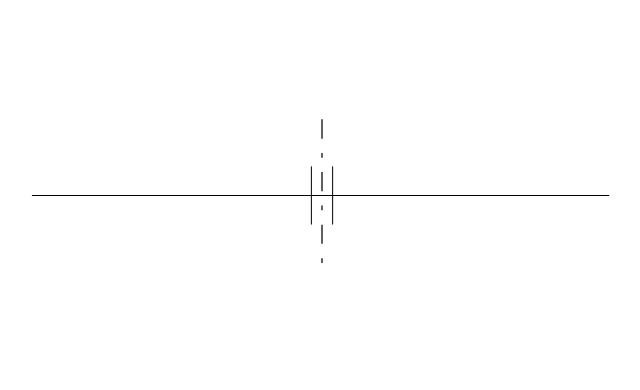
Anchor
Support / anchor
Hunger
Cross
Double branch

Jacketed
Sleeved

Sleeve joint

Expansion sleeve joint

Lagged
Bellows
Flow indication
Flow indication 2
Reducer

Reducer,arrow
Pipe bore change
Flexibility provision
Sleeve extension

Flow restrictor
Elbow 45

Elbow 90
Heated or cooled

Pneumatic line
Signal line
Electric line
Hydraulic line
Capillary line
Internal connection
Route radiation
Mechanical linkage

Electrical device
Vibratory device
Weight device
Spray device

Rotary motion
Stirring / fan
Access points

Trap

Expansion loop
Flexible hose
Flexible hose, flanged
- Design elements - Bank UML profile diagram | Extension Line Symbol
- Cable TV - Vector stencils library | Extension Arm
- Windows 8 apps - Vector stencils library | Extension Board Drawing
- Electrical Symbols, Electrical Diagram Symbols | Metro map ...
- Visio Files and ConceptDraw | SYSML | Astronomy | Drawings For ...
- Interior Design. Piping Plan — Design Elements | Tools to Create ...
- ConceptDraw Solution Park | Project Exchange | PM Easy | How To ...
- Excellent Examples of Infographic Maps | Subway Map | How to ...
- Business Productivity Area | Business Process Modeling Tools ...
- Seven Management and Planning Tools | Entity-Relationship ...