Landscape Plan
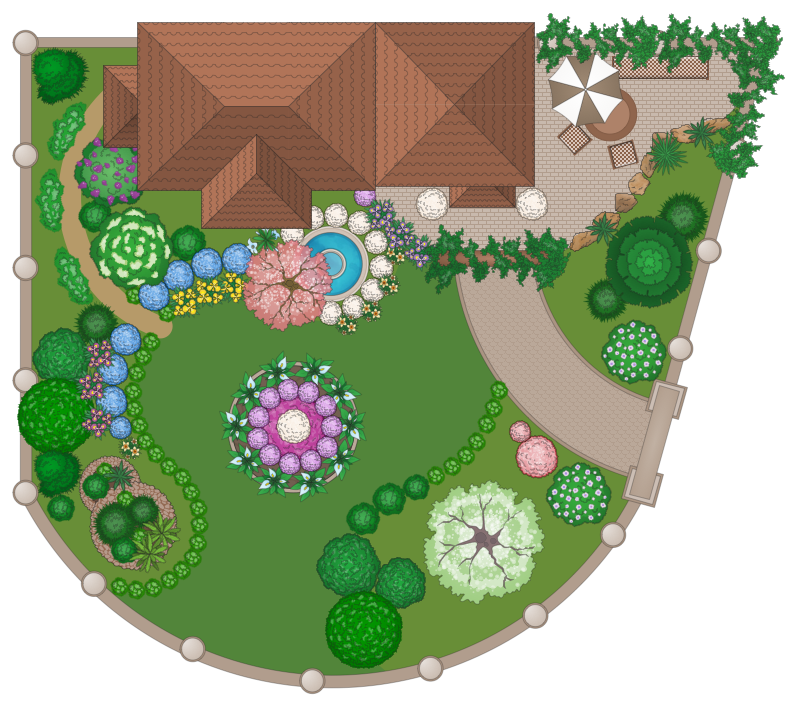
A landscape plan depicts all the features of a future garden including buildings, plants, lawns or a patio. Such plan is a very important part of site adjustment because it gives a complete picture of future project.Security Plans
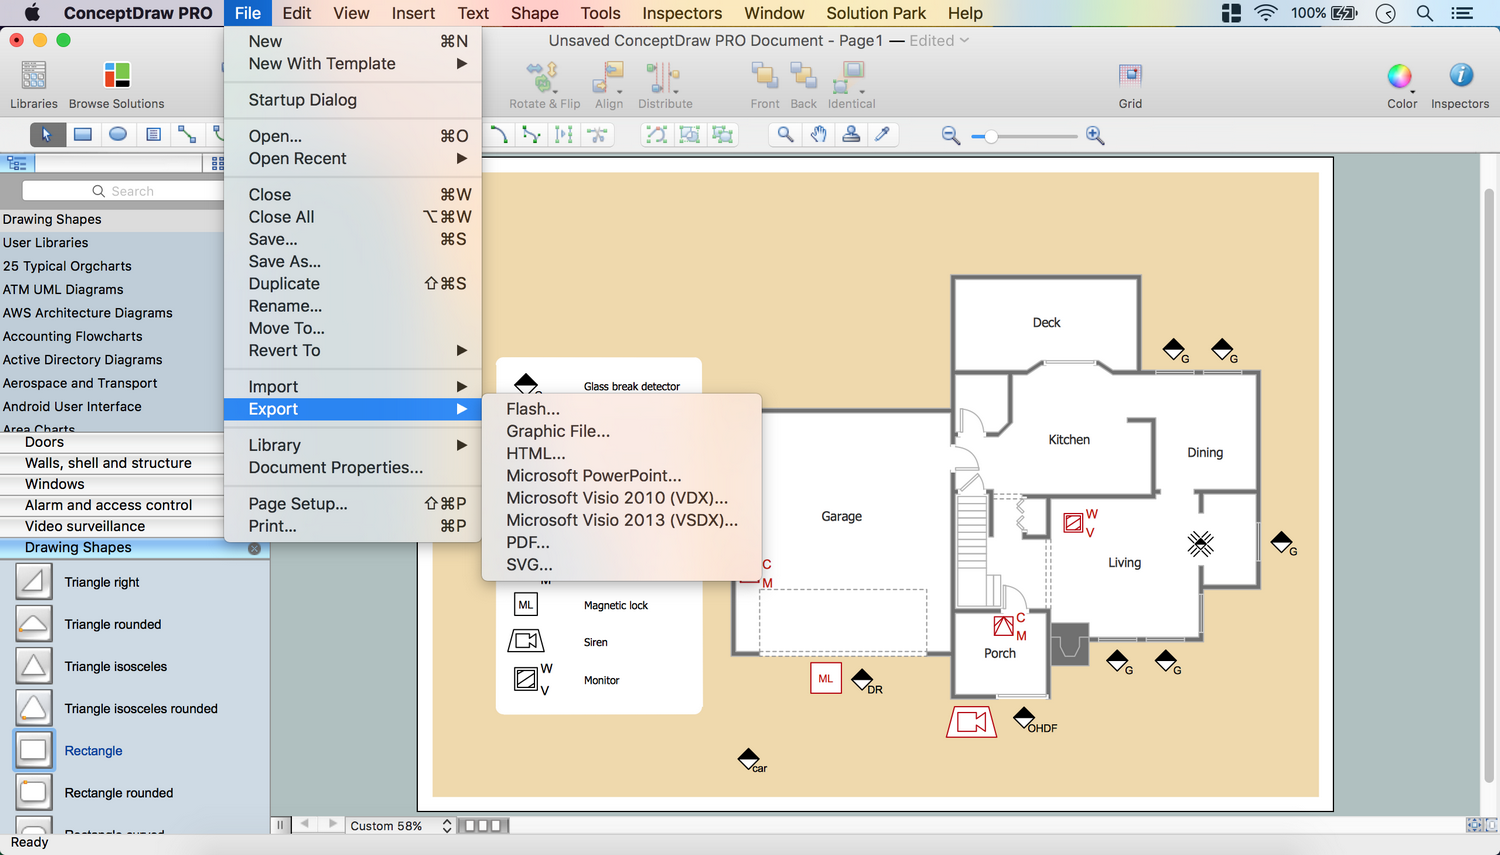
No security system cannot be constructed without detailed security plan, or even a set of plans in some cases. ConceptDraw PRO software offers the Security and Access Plans Solution from the Building Plans Area to help you design the Security Plans for any premises and of any complexity.Basic Flowchart Symbols and Meaning
Flowcharts are the best for visually representation the business processes and the flow of a custom-order process through various departments within an organization. ConceptDraw PRO diagramming and vector drawing software extended with Flowcharts solution offers the full set of predesigned basic flowchart symbols which are gathered at two libraries: Flowchart and Flowcharts Rapid Draw. Among them are: process, terminator, decision, data, document, display, manual loop, and many other specific symbols. The meaning for each symbol offered by ConceptDraw gives the presentation about their proposed use in professional Flowcharts for business and technical processes, software algorithms, well-developed structures of web sites, Workflow diagrams, Process flow diagram and correlation in developing on-line instructional projects or business process system. Use of ready flow chart symbols in diagrams is incredibly useful - you need simply drag desired from the libraries to your document and arrange them in required order. There are a few serious alternatives to Visio for Mac, one of them is ConceptDraw PRO. It is one of the main contender with the most similar features and capabilities.
Restaurant Floor Plans
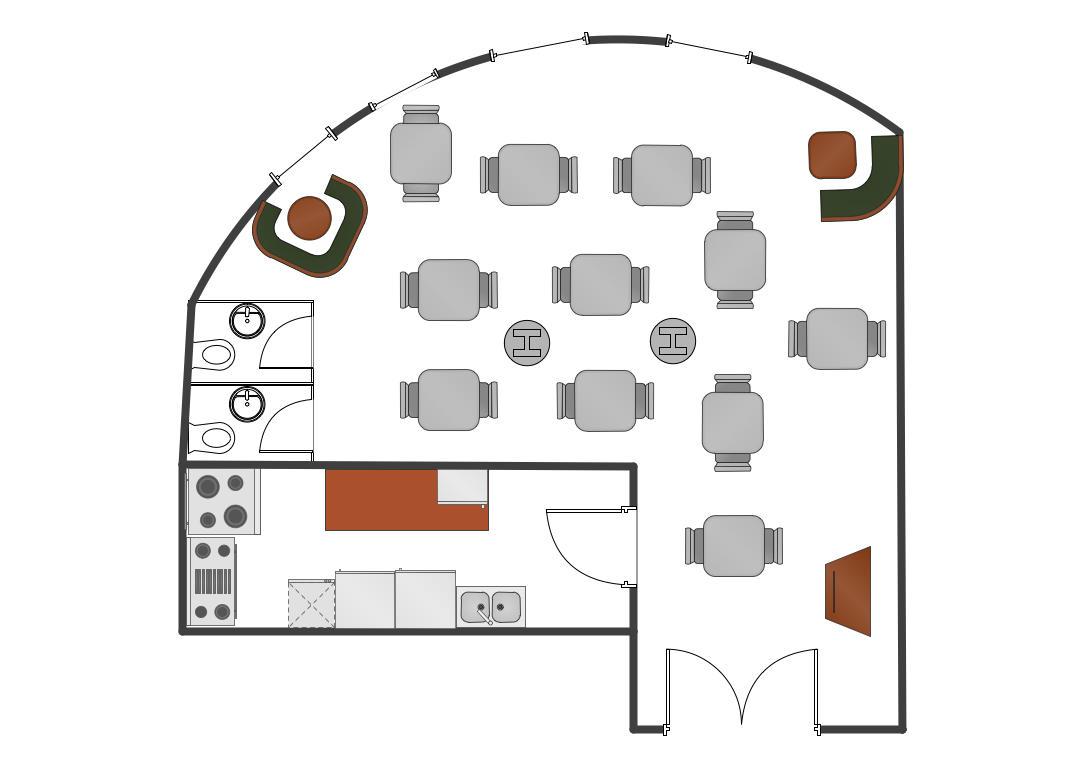
The restaurant business is considered as one of the most attractive types of investments. This service is characterized by a high level of competition, but at the same time it will be always in demand, the main thing is correctly approach to the question of organization. The making of business plan of the restaurant, cafe or bar with detailed calculations will help to organize effectively this type of activity, to define the goals, to think over the main concept, and to realize the careful planning. The business owner can make its own business plan for the restaurant from the beginning or to find the ready plan and to make the similar or to adjust it in accordance with its specific conditions, requirements and desires. ConceptDraw PRO software and Cafe and Restaurant Plans solution from the ConceptDraw Solution Park provide a lot of samples, templates and vector stencils libraries with ready-made design elements for effective and professional cafe, bar, and restaurant design and restaurant floor plan construction. Use them to achieve a success in restaurant business.
 Software Development Area
Solutions from the Software Development Area of ConceptDraw Solution Park collect templates, samples and libraries of vector stencils for drawing the software engineering diagrams and user interface design prototypes.
 Event-driven Process Chain Diagrams
Event-driven Process Chain (EPC) Diagram is a type of flowchart widely used for modeling in business engineering and reengineering, business process improvement, and analysis. EPC method was developed within the Architecture of Integrated Information Systems (ARIS) framework.
 IDEF0 Diagrams
IDEF0 Diagrams visualize system models using the Integration Definition for Function Modeling (IDEF) methodology. Use them for analysis, development and integration of information and software systems, and business process modelling.
 Entity-Relationship Diagram (ERD)
Entity-Relationship Diagram (ERD) solution extends ConceptDraw PRO software with templates, samples and libraries of vector stencils from drawing the ER-diagrams by Chen's and crow’s foot notations.
How to create a UML Diagram
ConceptDraw PRO extended with the Rapid UML solution is perfect for drawing professional UML diagrams.HelpDesk
Agile Mind Maps: Exploring the User Wishes
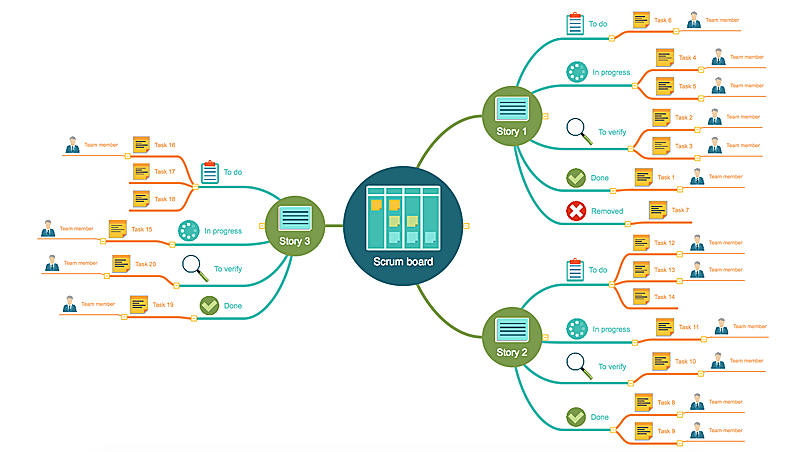
Agile method advocate use cases and user stories, but there are no standard processes or guides available to help gather user requirements. That is why documenting user requirements can be challenging. Without strong communication experience the scrum process can collapse, leading towards unfruitful requirements and imperfect software. This article offers a path to overcome these hurdles through the simplicity and clearness of mind mapping. ConceptDraw Scrum Worflow solution lets explore the user requirements for your Agile development project before they are formalized. You can easily create professional Mind Maps that will effectively collect and structure the information on what a user actually wants, or the “User Wish.”IDEF0 standard with ConceptDraw PRO
The activity of any organization is more or less branchy network of processes. The description of these processes is a hard technical task which requires definite methodology and standards. According to the IDEF0 standard any process can be described in the form of a block (Activity Box) which has inputs and outputs. The process consists in transformation of inputs into outputs under the influence of the management and in the presence of necessary resources. Outputs of the given process later on can be either inputs for the next process or resources, or management means.Diagramming Software for UML Composite Structure Diagrams
UML Composite Structure Diagram shows the internal structure of a class and the possible interactions at this structure.
Example of DFD for Online Store (Data Flow Diagram) DFD Example
Data Flow Diagram (DFD) is a methodology of graphical structural analysis and information systems design, which describes the sources external in respect to the system, recipients of data, logical functions, data flows and data stores that are accessed. DFDs allow to identify relationships between various system's components and are effectively used in business analysis and information systems analysis. They are useful for system’s high-level details modeling, to show how the input data are transformed to output results via the sequence of functional transformations. For description of DFD diagrams are uses two notations — Yourdon and Gane-Sarson, which differ in syntax. Online Store DFD example illustrates the Data Flow Diagram for online store, the interactions between Customers, Visitors, Sellers, depicts User databases and the flows of Website Information. ConceptDraw PRO enhanced with Data Flow Diagrams solution lets you to draw clear and simple example of DFD for Online Store using special libraries of predesigned DFD symbols.
- Program Development Plan Template
- Basic Flowchart Symbols and Meaning | How To use House ...
- Building Drawing Software for Design Site Plan | Building Drawing ...
- Rectangular Café Plan
- Landscape Design Plans
- Basic Flowchart Symbols and Meaning | How to Create a Timeline ...
- Design Element: Rack Diagram for Network Diagrams | Building ...
- Landscape Design Plan
- Design elements - Electrical and telecom
- Process Flowchart | Basic Flowchart Symbols and Meaning ...
- Bubble diagrams in Landscape Design with ConceptDraw PRO ...
- Building Drawing Software for Design Office Layout Plan | How To ...
- Bubble diagrams in Landscape Design with ConceptDraw PRO ...
- Graphical Symbols Of Building Site Plan
- Bubble diagrams in Landscape Design with ConceptDraw PRO ...
- Process Flowchart | Basic Flowchart Symbols and Meaning | Sales ...
- Landscape Architecture with ConceptDraw PRO | Seating Chart ...
- Process Flowchart | Basic Flowchart Symbols and Meaning | Sales ...
- Bubble diagrams in Landscape Design with ConceptDraw PRO ...
- IDEF0 standard with ConceptDraw PRO | IDEF0 Diagrams | IDEF0 ...


