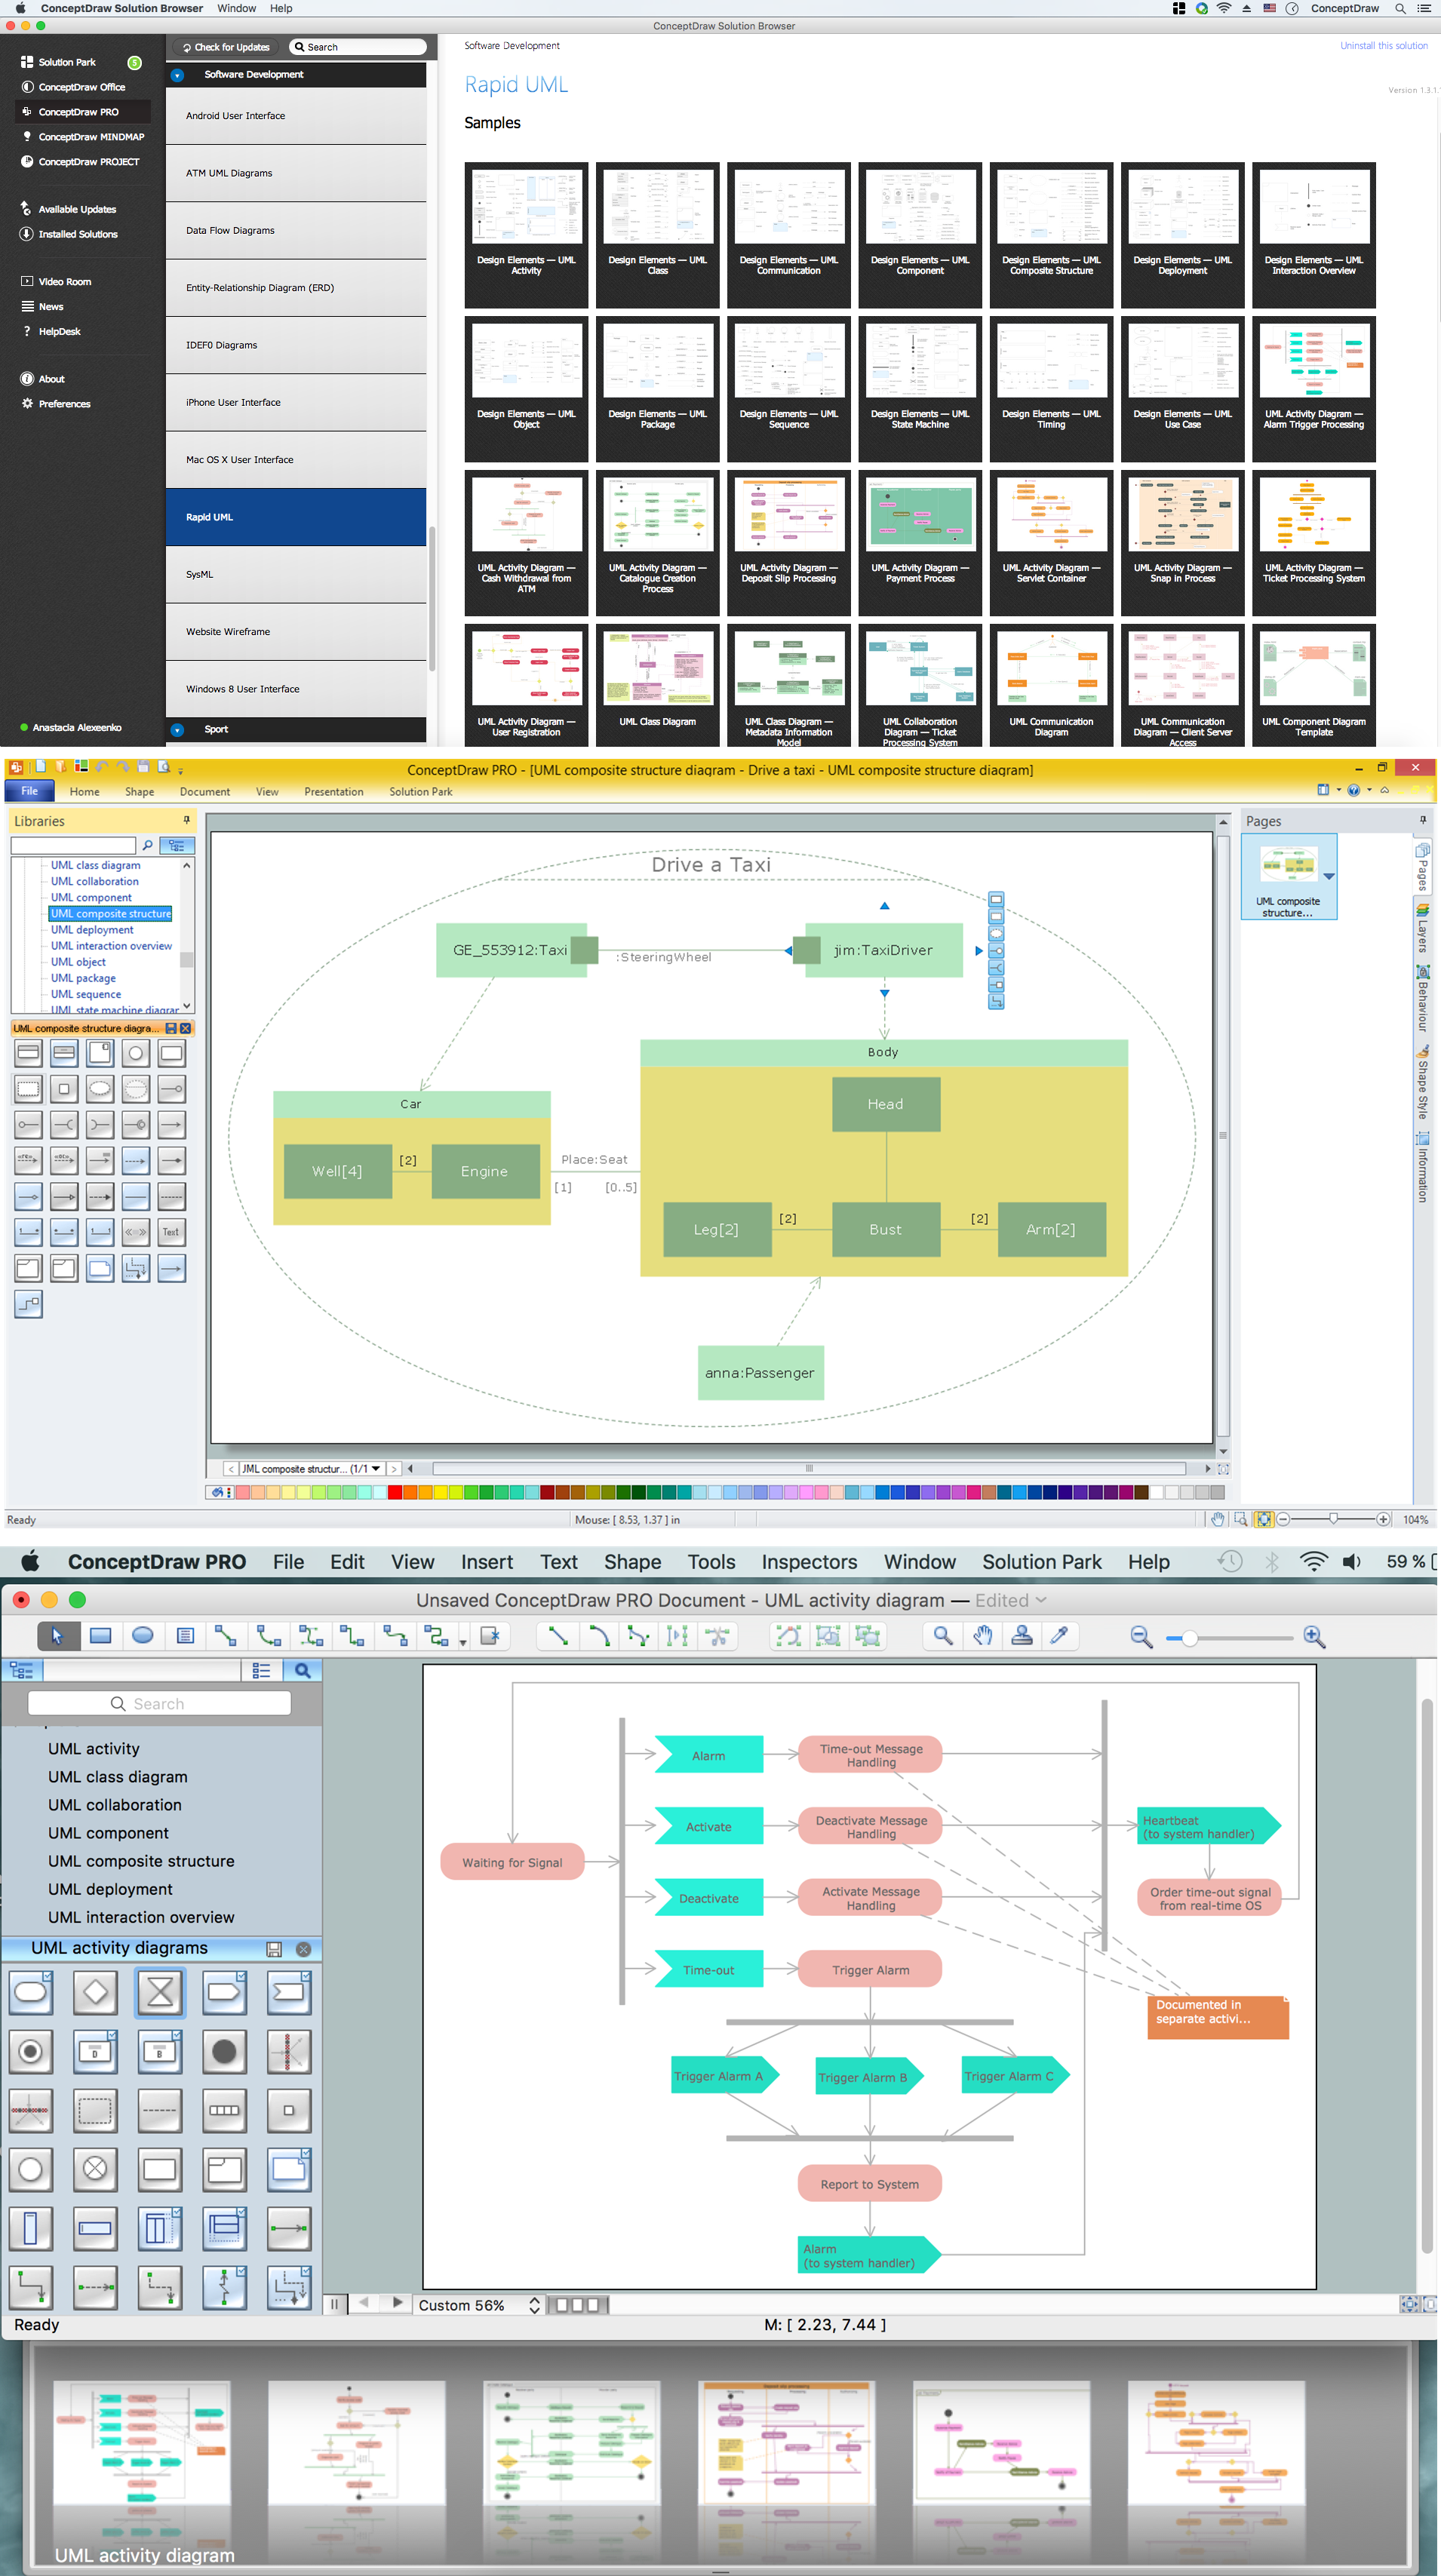
How to create your UML Diagram
 Entity-Relationship Diagram (ERD)
Entity-Relationship Diagram (ERD) solution extends ConceptDraw DIAGRAM software with templates, samples and libraries of vector stencils from drawing the ER-diagrams by Chen's and crow’s foot notations.
 Fishbone Diagrams
The Fishbone Diagrams solution extends ConceptDraw DIAGRAM software with the ability to easily draw the Fishbone Diagrams (Ishikawa Diagrams) to clearly see the cause and effect analysis and also problem solving. The vector graphic diagrams produced using this solution can be used in whitepapers, presentations, datasheets, posters, and published technical material.
 Concept Maps
The technique of concept mapping was developed as a constructive way of representing knowledge in science and increasing the meaningfulness of learning. Now, the creation of a concept map is extremely helpful when used in education as learning and teaching techniques that assist memorization. Concept maps are also used for idea generation in brainstorming sessions, and for detailing the structure of complex ideas.
 Data Flow Diagrams (DFD)
Data Flow Diagrams solution extends ConceptDraw DIAGRAM software with templates, samples and libraries of vector stencils for drawing the data flow diagrams (DFD).
 AWS Architecture Diagrams
AWS Architecture Diagrams with powerful drawing tools and numerous predesigned Amazon icons and AWS simple icons is the best for creation the AWS Architecture Diagrams, describing the use of Amazon Web Services or Amazon Cloud Services, their application for development and implementation the systems running on the AWS infrastructure. The multifarious samples give you the good understanding of AWS platform, its structure, services, resources and features, wide opportunities, advantages and benefits from their use; solution’s templates are essential and helpful when designing, description and implementing the AWS infrastructure-based systems. Use them in technical documentation, advertising and marketing materials, in specifications, presentation slides, whitepapers, datasheets, posters, etc.
 ConceptDraw Solution Park
ConceptDraw Solution Park collects graphic extensions, examples and learning materials
 Block Diagrams
Block diagrams solution extends ConceptDraw DIAGRAM software with templates, samples and libraries of vector stencils for drawing the block diagrams.
HelpDesk
How to Add a Block Diagram to a PowerPoint Presentation

Software Diagram Examples and Templates

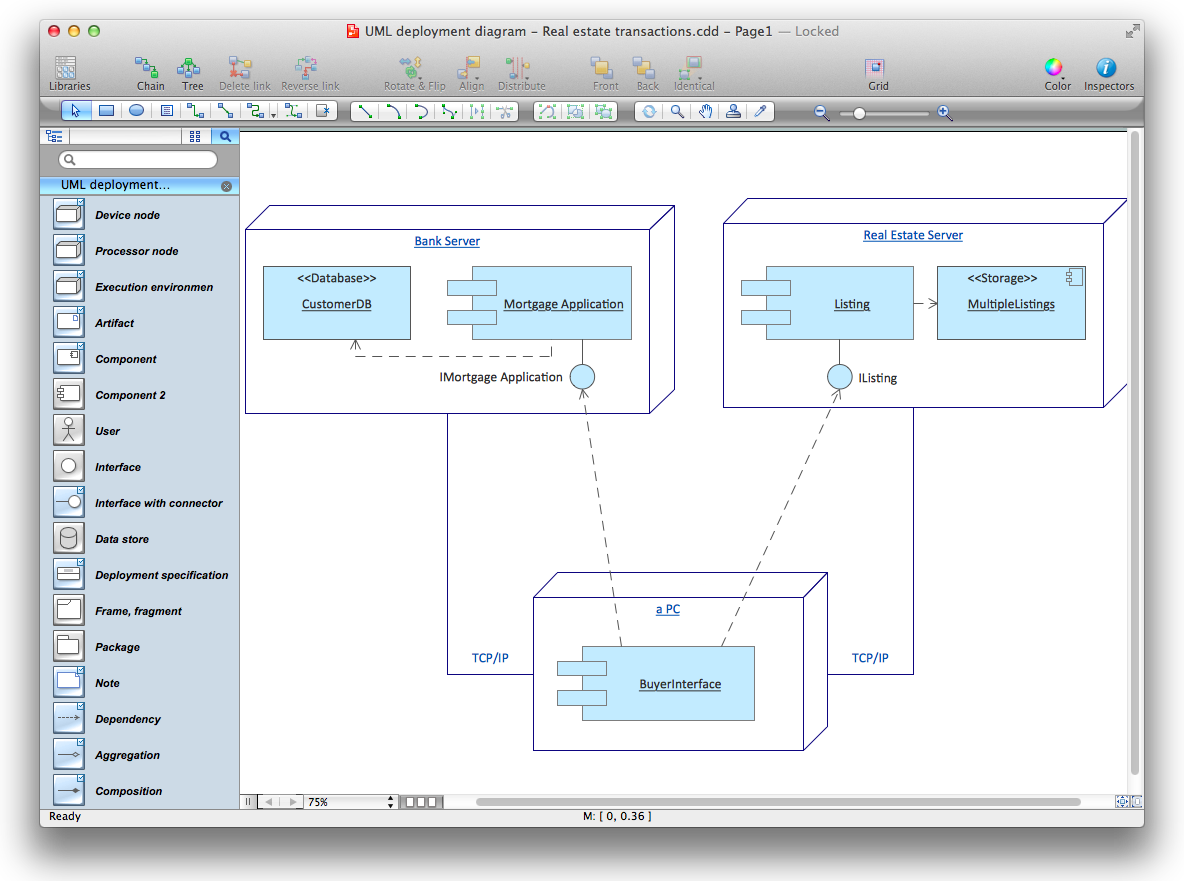
UML Deployment Diagram. Diagramming Software for Design UML Diagrams

 Sales Flowcharts
The Sales Flowcharts solution lets you create and display sales process maps, sales process workflows, sales steps, the sales process, and anything else involving sales process management.
Business Diagram Software


- UML Component Diagram Example - Online Shopping | UML Tool ...
- UML Component Diagram Example
- UML Class Diagram Example - Medical Shop | UML Notation | Basic ...
- UML Class Diagram Example for Transport System | UML Tool ...
- State Diagram Example - Online Store | UML Component Diagram ...
- UML Deployment Diagram Example - ATM System | UML Use Case ...
- UML Use Case Diagram Example Social Networking Sites Project ...
- UML Activity Diagram | Diagramming Software for Design UML ...
- UML Deployment Diagram
- UML Component Diagram Example - Online Shopping ...
- UML Component Diagram Example - Online Shopping | State ...
- Uml Diagram Sample
- Rapid UML | UML Tool & UML Diagram Examples | UML ...
- State Chart Diagram For Online Shopping System
- UML Class Diagram Example - Medical Shop
- UML Tool & UML Diagram Examples | UML Collaboration Diagram ...
- UML Tool & UML Diagram Examples
- Online store social media response flowchart | Example of DFD for ...
- Use Case Diagrams For Bank Management
- UML Deployment Diagram