UML Use Case Diagram Example. Registration System

 ATM UML Diagrams
The ATM UML Diagrams solution lets you create ATM solutions and UML examples. Use ConceptDraw DIAGRAM as a UML diagram creator to visualize a banking system.
UML Use Case Diagram Example. Social Networking Sites Project

UML Tool & UML Diagram Examples

This UML sequence diagram of order processing center (OPC) was created on the base of sequence diagram from the software architecture documentation wiki of the Software Engineering Institute (SEI) of Carnegie Mellon University (CMU).
[wiki.sei.cmu.edu/ sad/ index.php/ Image:OPCRuntimeRefinementView_ PP2.png]
"Order processing is the process or work-flow associated with the picking, packing and delivery of the packed items to a shipping carrier. Order processing is a key element of order fulfillment. Order processing operations or facilities are commonly called "distribution centers"." [Order processing. Wikipedia]
This order processing center UML sequence diagram example was created using the ConceptDraw PRO diagramming and vector drawing software extended with the ATM UML Diagrams solution from the Software Development area of ConceptDraw Solution Park.
Order processing center UML sequence diagram

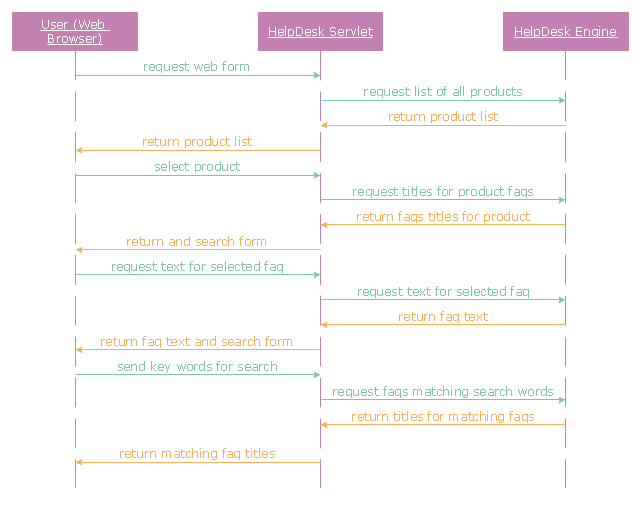
"A help desk is a resource intended to provide the customer or end user with information and support related to a company's or institution's products and services. The purpose of a help desk is usually to troubleshoot problems or provide guidance about products such as computers, electronic equipment, food, apparel, or software. Corporations usually provide help desk support to their customers through various channels such as toll-free numbers, websites, instant messaging, or email. There are also in-house help desks designed to provide assistance to employees." [Help desk. Wikipedia]
The UML sequence diagram example "Help desk" was created using the ConceptDraw PRO diagramming and vector drawing software extended with the Rapid UML solution from the Software Development area of ConceptDraw Solution Park.
The UML sequence diagram example "Help desk" was created using the ConceptDraw PRO diagramming and vector drawing software extended with the Rapid UML solution from the Software Development area of ConceptDraw Solution Park.
UML sequence diagram
Examples of Flowcharts, Org Charts and More


Influence Diagram

 Jackson Structured Programming (JSP) Diagrams
The Jackson Structured Programming (JSP) Diagram solution extends the functionality and drawing abilities of the ConceptDraw DIAGRAM software with set of illustrative JSP diagrams samples and large variety of predesigned vector objects of actions, processes, procedures, selection, iteration, as well as arrows and connectors to join the objects during Jackson structured development and designing Jackson structured programming diagrams, JSP diagram, Jackson structure diagram (JSD), Program structure diagram. The powerful abilities of this solution make the ConceptDraw DIAGRAM ideal assistant for programmers, software developers, structural programmers, computer engineers, applications constructors, designers, specialists in structured programming and Jackson systems design, and other technical, computer and software specialists.
UML Diagram for System

Software development with ConceptDraw products

ER Diagram for Cloud Computing

 Business Process Workflow Diagrams
The Business Process Workflow Diagrams solution enhances the ConceptDraw DIAGRAM functionality with predesigned examples, samples and a numerous collection of predesigned vector objects of workflow chart elements, icons, arrows, connectors, and varied wor
How to Create Flowcharts for an Accounting Information System

ConceptDraw DIAGRAM - Organizational chart software

Selecting & Creating Flowcharts

Network Diagram Software Enterprise Private Network


Campus Area Networks (CAN). Computer and Network Examples
. <br>Computer and Network Examples *")
Cross-Functional Flowchart


- Draw A Sequence Diagram For Online University Admission System
- UML Use Case Diagram Example Registration System | Process ...
- Process Flowchart | UML Use Case Diagram Example Registration ...
- UML Use Case Diagram Example Registration System | Draw Use ...
- Class Diagram For Online Admission In University
- Create A Use Case Diagram For University Management System
- Order processing center - UML sequence diagram | UML sequence ...
- Order processing center - UML sequence diagram | Order process ...
- Rapid UML | SYSML | Event-driven Process Chain Diagrams ...
- Sequence Diagram How To Draw Asynchronous
- ATM Sequence diagram | Process Flowchart | Event-driven Process ...
- Activity Diagram For Admission Process
- Order processing center - UML sequence diagram | Order ...
- ATM Sequence diagram | ATM UML Diagrams | Timeline Diagrams ...
- Sequence Diagram for Cloud Computing | UML Sequence Diagram ...
- UML activity diagram - Cash withdrawal from ATM | ATM UML ...
- UML Use Case Diagram Example Registration System | Process ...
- Data Flow Diagrams (DFD) | ConceptDraw PRO DFD Software | Dfd ...
- Class Diagram For University Admission System
- Data Flow Diagram For Admission System