 Computer Network Diagrams
Computer Network Diagrams solution extends ConceptDraw DIAGRAM software with samples, templates and libraries of vector icons and objects of computer network devices and network components to help you create professional-looking Computer Network Diagrams, to plan simple home networks and complex computer network configurations for large buildings, to represent their schemes in a comprehensible graphical view, to document computer networks configurations, to depict the interactions between network's components, the used protocols and topologies, to represent physical and logical network structures, to compare visually different topologies and to depict their combinations, to represent in details the network structure with help of schemes, to study and analyze the network configurations, to communicate effectively to engineers, stakeholders and end-users, to track network working and troubleshoot, if necessary.
Network Topologies


 iPhone User Interface
iPhone User Interface solution extends ConceptDraw DIAGRAM software with templates, samples and libraries with large quantity of vector stencils of graphical user interface elements, Apps icons, UI patterns for designing and prototyping of the iOS applic
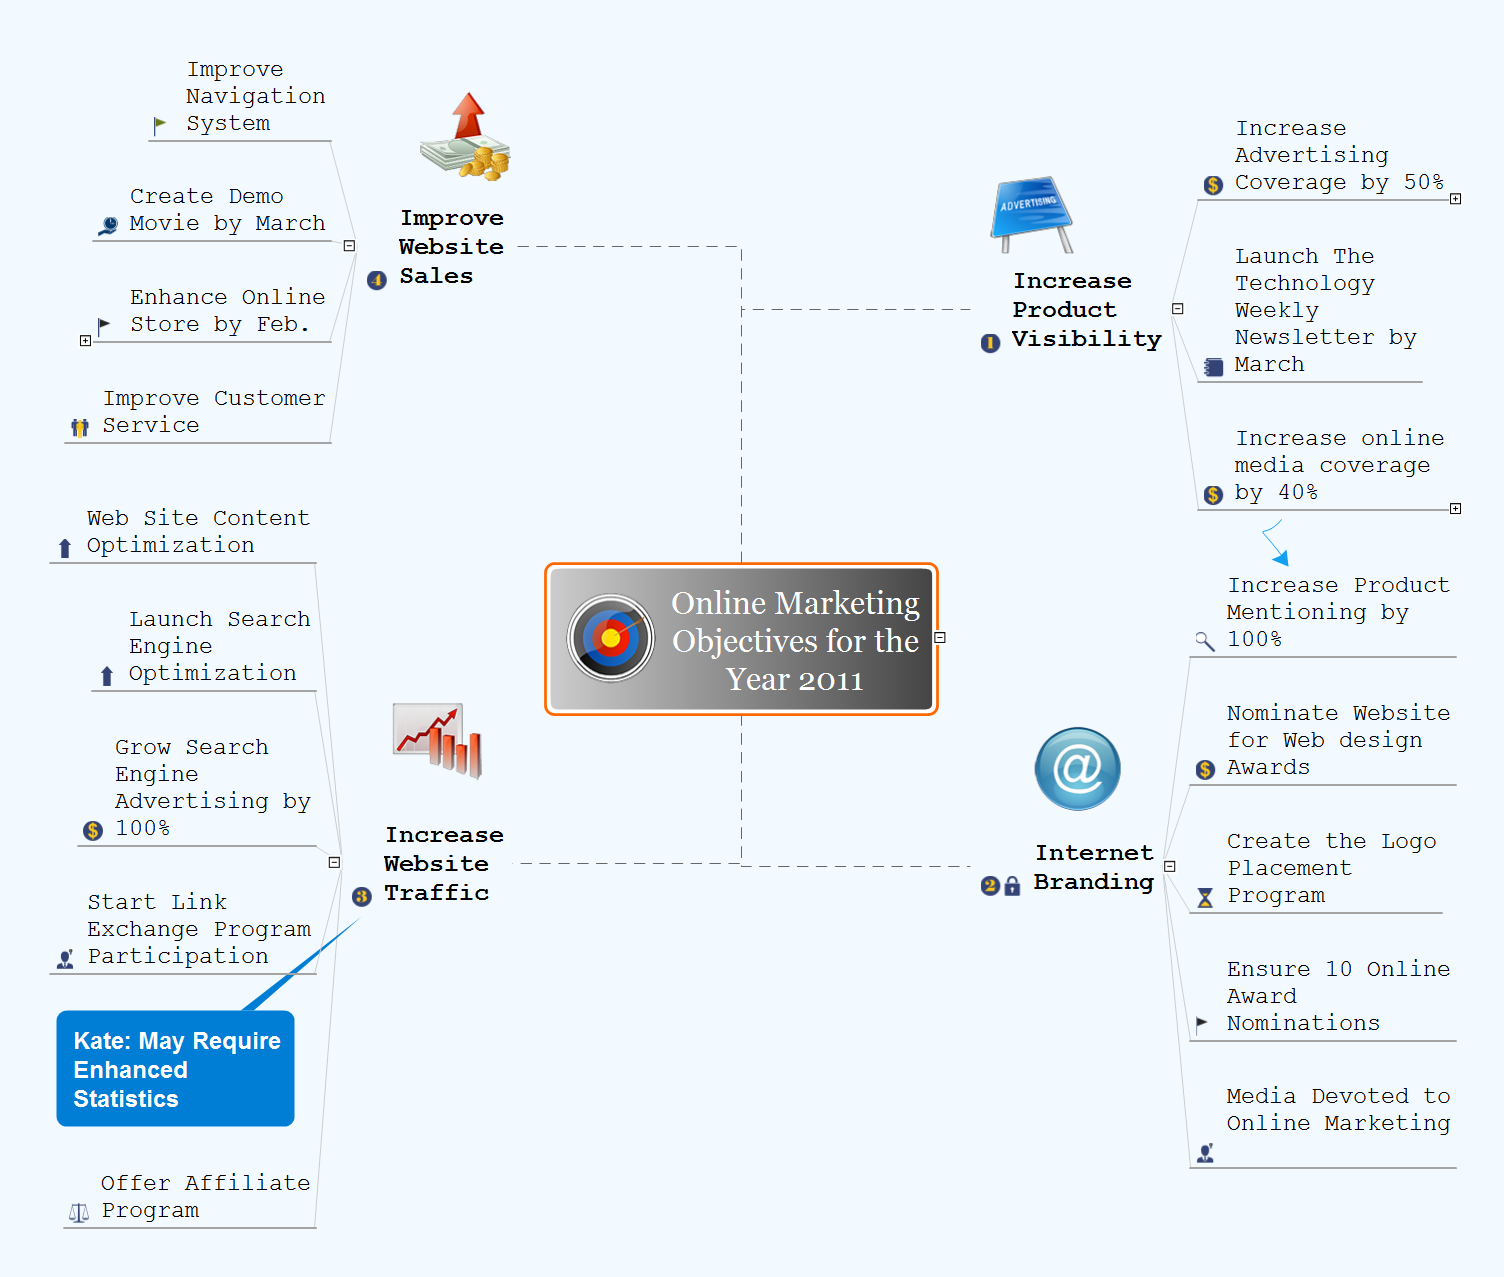
Online Marketing Objectives
 Holiday
The Holiday Solution from Illustration area of ConceptDraw Solution Park contains holiday illustration examples, templates and vector clipart library.
 MindTweet
This solution extends ConceptDraw MINDMAP software with the ability to brainstorm, review and organize the sending of Tweets.
 Social Media Response
This solution extends ConceptDraw DIAGRAM and ConceptDraw MINDMAP with the ability to draw interactive flow charts with action mind map templates, to help create an effective response to applicable social media mentions.
Business Process Workflow Diagram

The workflows on the Business Process Workflow Diagram are represented using the set of common symbols which let easy illustrate business processes and process flows, depict the start, all major steps and end of the process, what data are used by the process, how the data flow through the business areas within scope of our project, how the tasks are executed and by who, and how workers interact with each other.

What is MindMap presentation via Skype?
 Word Exchange
This solution extends ConceptDraw MINDMAP software with the ability to quickly create the framework for a future article or book, fill the structure with ideas, and use it to produce an MS Word document with just a simple click of the mouse.
Network Diagram Software. LAN Network Diagrams. Physical Office Network Diagrams


Root Cause Tree Diagram

- Ivr Icons
- How to Send an Outlook Email From a Mind Map | How to Add ...
- IVR business - Vector stencils library | Design elements - IVR ...
- IVR business - Vector stencils library
- Security Response Icon
- Ivr Icon Vector
- IVR business - Vector stencils library | Business process BPMN 1.2 ...
- Cisco Network Topology. Cisco icons , shapes, stencils and symbols ...
- Task List Icon
- Shopping Bag Icon Png
- Cisco Multimedia, Voice, Phone. Cisco icons , shapes, stencils and ...
- IVR business - Vector stencils library | Travel and tourism pictograms ...
- What is IVR? | Interactive Voice Response System | Interactive voice ...
- Flowchart design. Flowchart symbols, shapes, stencils and icons ...
- IVR business - Vector stencils library | White Paper Bag Plane
- IVR business - Vector stencils library | Business - Vector stencils ...
- Design elements - Icons | GUI Interface | Design elements - IVR ...
- Design elements - IVR blocks | IVR systems architecture | Call ...
- IVR balance recharge | Interactive Voice Response Diagrams ...
- Cybersecurity - Vector stencils library | IVR computer - Vector ...
- ERD | Entity Relationship Diagrams, ERD Software for Mac and Win
- Flowchart | Basic Flowchart Symbols and Meaning
- Flowchart | Flowchart Design - Symbols, Shapes, Stencils and Icons
- Flowchart | Flow Chart Symbols
- Electrical | Electrical Drawing - Wiring and Circuits Schematics
- Flowchart | Common Flowchart Symbols
- Flowchart | Common Flowchart Symbols