 Timeline Diagrams
Timeline Diagrams solution extends ConceptDraw DIAGRAM diagramming software with samples, templates and libraries of specially developed smart vector design elements of timeline bars, time intervals, milestones, events, today marker, legend, and many other elements with custom properties, helpful for professional drawing clear and intuitive Timeline Diagrams. Use it to design simple Timeline Diagrams and designate only the main project stages, or highly detailed Timeline Diagrams depicting all project tasks, subtasks, milestones, deadlines, responsible persons and other description information, ideal for applying in presentations, reports, education materials, and other documentation.
 Seven Management and Planning Tools
Seven Management and Planning Tools solution extends ConceptDraw DIAGRAM and ConceptDraw MINDMAP with features, templates, samples and libraries of vector stencils for drawing management mind maps and diagrams.
 Infographics Area
Solutions of the area What is Infographics from ConceptDraw Solution Park collect templates, samples and vector stencils libraries with design elements for the drawing information graphics.
 Business Processes
Business Process solution extends ConceptDraw DIAGRAM software with business process diagrams as cross-functional flowcharts, workflows, process charts, IDEF0, timelines, calendars, Gantt charts, business process modeling, audit and opportunity flowcharts.
 Business Productivity Area
Business Productivity Solutions extend ConceptDraw products with tools for making presentations, conducting meetings, preparing documents, brainstorming, or building new strategies.
Activity Network (PERT) Chart

Communication Tool for Remote Project Management

Examples of Flowcharts, Org Charts and More


Create a Value Stream Map
 Management
This solution extends ConceptDraw DIAGRAM and ConceptDraw MINDMAP with Management Diagrams and Mind Maps (decision making, scheduling, thinking ideas, problem solving, business planning, company organizing, SWOT analysis, preparing and holding meetings
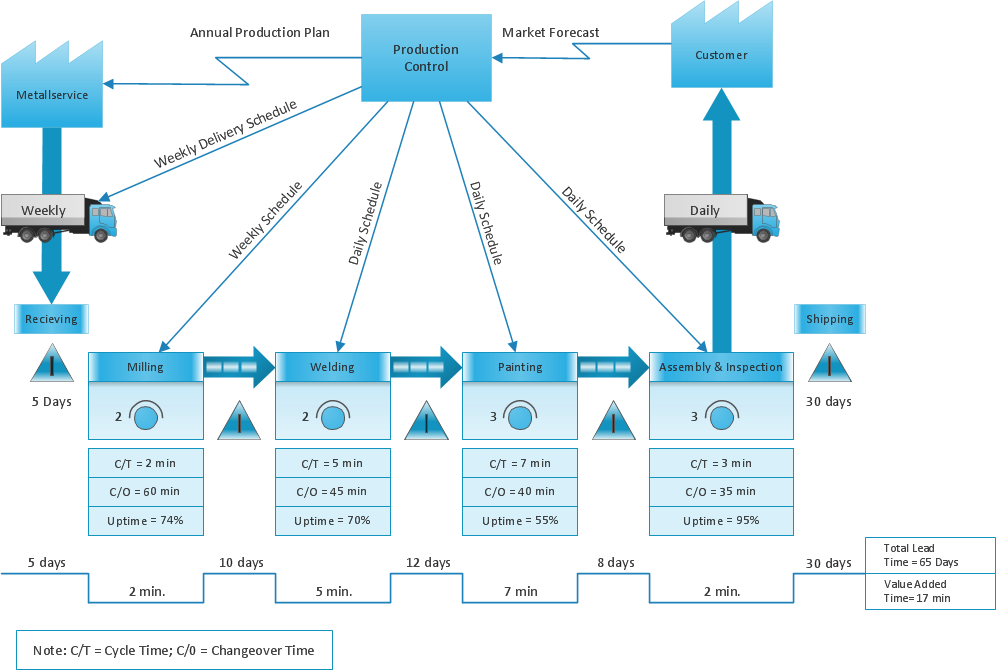
"Value Stream Mapping (VSM):
– Special type of flow chart that uses symbols known as "the language of Lean" to depict and improve the flow of inventory information. ...
Value Stream Mapping ...
Provide optimum value to the customer through a complete value creation process with minimum waste in:
– Design (concept to customer);
– Design (concept to customer);
– Build (order to delivery);
– Sustain (in-use through life cycle to service)." [courses.washington.edu/ ie337/ Value_ Stream_ Mapping.pdf]
This sample Value Stream Map shows how customer value is created in the steps of manufacturing, production control, and shipping processes.
This VSM example was created using the ConceptDraw PRO diagramming and vector drawing software extended with the Value Stream Mapping solution from the Quality area of ConceptDraw Solution Park.
Value stream mapping

Business Process Mapping — How to Map a Work Process

 Quality
This solution extends ConceptDraw DIAGRAM and ConceptDraw MINDMAP with Quality Management Diagrams (Total Quality Management Diagrams, Timelines, Workflows, Value Stream Maps) and Mind Maps (Presentations, Meeting Agendas, Problem to be solved).
 PM Easy
PM Easy solution extends the ConceptDraw PROJECT functionality with an ability to support neutral methodology of project management and to quickly start a project by listing the task relationships and dependencies, that makes the iterative planning much easier. The project management tool and available visual tools, such as mind mapping, increase the effectiveness of tracking and analysis your project tasks. PM Easy solution from ConceptDraw Solution Park is mainly targeted at project managers in small or medium-sized companies, allowing them to make the project plan and execute projects using mind mapping technique, to implement planning using mind mapping, and to track tasks using ConceptDraw PROJECT application.
 Marketing
This solution extends ConceptDraw DIAGRAM and ConceptDraw MINDMAP with Marketing Diagrams and Mind Maps (brainstorming, preparing and holding meetings and presentations, sales calls).
ConceptDraw DIAGRAM The best Business Drawing Software

Learn how to create a current state value stream map

How To create Value Stream Map (VSM)

Value Stream Maps Visualize
- Value stream map example | Timeline Diagrams | Communication ...
- Timeline Diagrams | Line Chart Examples | Line Graph Charting ...
- Timeline Diagrams | Line Chart Examples | Value stream map ...
- Timeline Diagrams | Value stream map example | Business ...
- Timeline Diagrams | ConceptDraw PRO The best Business Drawing ...
- Timeline template | Examples of Flowcharts, Org Charts and More ...
- Timeline Diagrams | Timeline diagram template | Project timeline ...
- Communication Tool for Remote Project Management | Timeline ...
- Business Processes | Timeline Diagrams | Business diagrams & Org ...
- Project timeline diagram
- Project timeline diagram - New business project plan | Timeline ...
- Management | Timeline Diagrams | Value stream map example |
- PM Personal Time Management | Project Management Area | PM ...
- Timeline Diagrams | Business diagrams & Org Charts with ...
- Project timeline diagram - Conceptdraw.com
- PM Personal Time Management | Total Quality Management TQM ...
- Value stream map example | Marketing | Management |
- Timeline Diagrams | Marketing | Management |
- Timeline Diagrams | Management | Marketing |
- Timeline Diagrams | Communication Tool for Remote Project ...