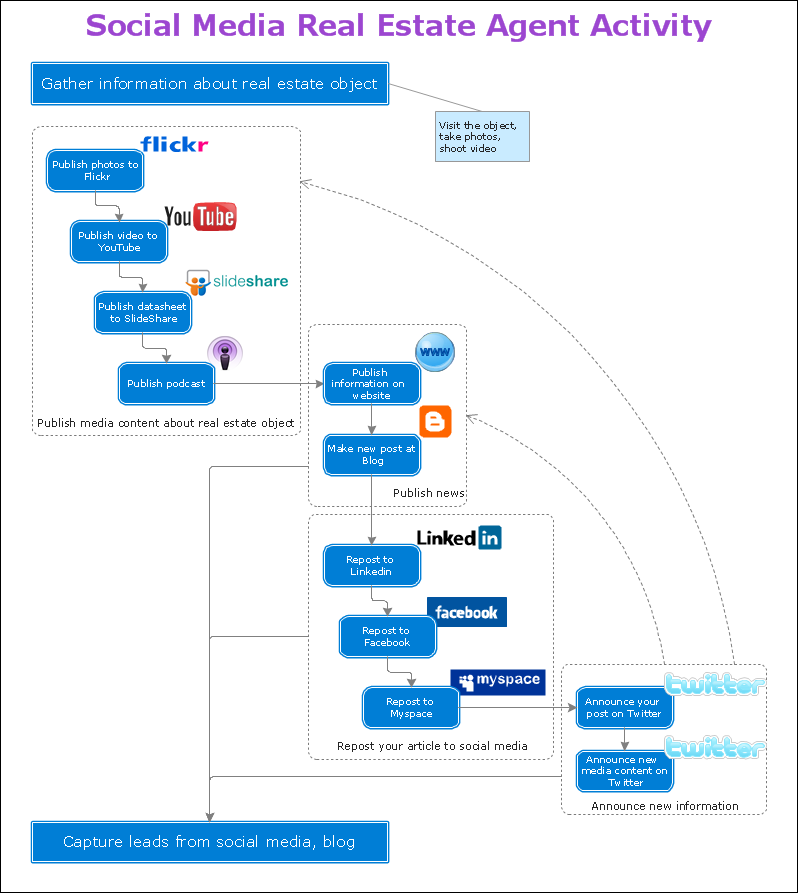
How to Create a Social Media DFD Flowchart
The use of social media in modern conditions helps the companies to be more effective in timely messaging - actively and rapidly response to a customer posts in social media, to find quickly the appropriate response to social media mentions, to save greatly the budget. Many companies even use the social media as a lead tool for promotion. But how to create a Social Media DFD Flowchart, Social Media Response Flowchart or Action Mind Map fast and easy? ConceptDraw PRO vector graphical software and Social Media Response solution included to ConceptDraw Solution Park assist greatly in their creation. This solution improves the quality of content in social media and helps to build an active customer community. The samples and examples included to Social Media Response solution are helpful for social media teams in developing a social media strategy, in refining and organizing the response process, in creation training materials by trainers and consultants for education the social media groups on how to accomplish the most effectiveness in their daily work.Dashboard
ConceptDraw PRO extended with Sales Dashboard solution from the Marketing area of ConceptDraw Solution Park is a perfect software for creating the live dashboard for the business data and progress visualization.How to Use the ″Online Store PR Campaign″ Sample
Interactive tool helps you find the appropriate response to social media mentions quickly.How to Connect Social Media DFD Flowchart with Action Maps
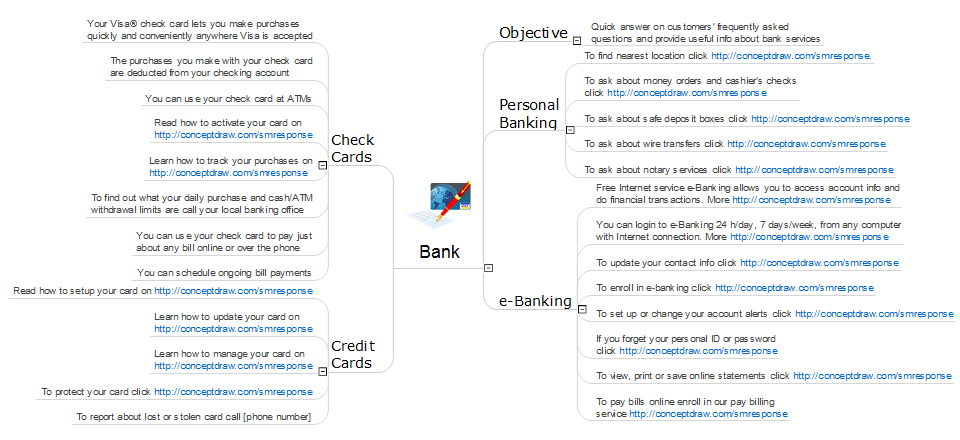
The Social Media Response solution creates interactive social media flow charts and action mind maps. The solution includes a video tutorial and a number of samples helping social media teams refine and organize their response process.How to Present a Social Media Response Plan DFD to Your Team
Interactive tool helps you find the appropriate response to social media mentions quickly. There are materials to help trainers and consultants develop a social media strategy and provide training for social media groups on how to effectively accomplish their daily work.Data Visualization Solutions
Data visualization solutions help you to see how your business can improve. Visualizing sales data using ConceptDraw Sales Dashboard gives you a bird's-eye view of the sale process.Organizing and Selecting Social Media Response Action
Interactive tool helps you find the appropriate response to social media mentions quickly.Pyramid Diagram
ConceptDraw Pyramid Diagram software allows drawing column charts using predesigned objects or drawing tools.Sales Teams are Inherently Competitive
Sales teams are inherently competitive, so you don't need to invent extra ways to stimulate the competition. At the same time, you can provide the team with a sales dashboard shows company, team and personal KPI to make the competition clear.Sales Growth. Bar Graphs Example
This sample was created in ConceptDraw PRO diagramming and vector drawing software using the Bar Graphs Solution from Graphs and Charts area of ConceptDraw Solution Park. It is Bar Graphs example, Sales Growth example, Column Chart Example - Sales Report.What Is an Action Mind Map
Interactive tool helps you find the appropriate response to social media mentions quickly.How to Prepare Learning Presentations for Training
Interactive tool helps you find the appropriate response to social media mentions quickly.Polar Graph
This sample shows the Polar Graph. The Polar Graph is a graph in the polar coordinate system in which the each point on the plane is defined by two values - the polar angle and the polar radius. The certain equations have very complex graphs in the Cartesian coordinates, but the application of the polar coordinate system allows usually produce the simple Polar Graphs for these equations.Activity Network (PERT) Chart
Activity Network and Project Evaluation and Review Technique, or PERT, charts are a way of documenting and analyzing the tasks in a project. This diagram is constructed as part of the process in creating a schedule of corrective actions. The Activity Network Chart (PERT) shows the logical connections and consequence of tasks to be performed. It displays the time period for problem solving and the implementation of all activities through the critical path.Basic Flowchart Symbols and Meaning
Flowcharts are the best for visually representation the business processes and the flow of a custom-order process through various departments within an organization. ConceptDraw PRO diagramming and vector drawing software extended with Flowcharts solution offers the full set of predesigned basic flowchart symbols which are gathered at two libraries: Flowchart and Flowcharts Rapid Draw. Among them are: process, terminator, decision, data, document, display, manual loop, and many other specific symbols. The meaning for each symbol offered by ConceptDraw gives the presentation about their proposed use in professional Flowcharts for business and technical processes, software algorithms, well-developed structures of web sites, Workflow diagrams, Process flow diagram and correlation in developing on-line instructional projects or business process system. Use of ready flow chart symbols in diagrams is incredibly useful - you need simply drag desired from the libraries to your document and arrange them in required order. There are a few serious alternatives to Visio for Mac, one of them is ConceptDraw PRO. It is one of the main contender with the most similar features and capabilities.
- Sales Growth. Bar Graphs Example | Bar Chart Examples | Bar ...
- Sales Growth. Bar Graphs Example | Sales Dashboards for Your ...
- Sales Report In Bar Chart Of Different Companies
- Sales Growth. Bar Graphs Example | Marketing and Sales ...
- Sales Process Flowchart. Flowchart Examples | How to Report on ...
- Draw Company Structure with Organization Charting Software | Pie ...
- How to Create a Social Media DFD Flowchart | How to Connect ...
- Sales Process Flowchart. Flowchart Examples | Audit Process ...
- Quality visualization in your company | Sales Process Flowchart ...
- Business Report Pie. Pie Chart Examples | Bar Chart Examples ...
- Column Chart Examples Sales Report
- Pie Donut Chart. Pie Chart Examples | Business Report Pie. Pie ...
- TQM Diagram Example | Sales Growth. Bar Graphs Example | Ansoff ...
- SWOT matrix template | What is SWOT Analysis in Marketing | SWOT ...
- Sales Growth. Bar Graphs Example | Sales Process Flowchart ...
- Sales Growth. Bar Graphs Example | Marketing and Sales ...
- Sales Growth. Bar Graphs Example | Bar Chart Examples | Create ...
- Sales Process Flowchart. Flowchart Examples | How to Create a ...
- Sales Growth. Bar Graphs Example | TQM Diagram Tool | Sales ...
- Sales Growth. Bar Graphs Example | Online Collaboration via Skype ...


