Sales Growth. Bar Graphs Example

Bar Chart Examples

Online Collaboration via Skype


Bar Diagrams for Problem Solving. Create manufacturing and economics bar charts with Bar Graphs Solution

Create Graphs and Charts

Polar Graph

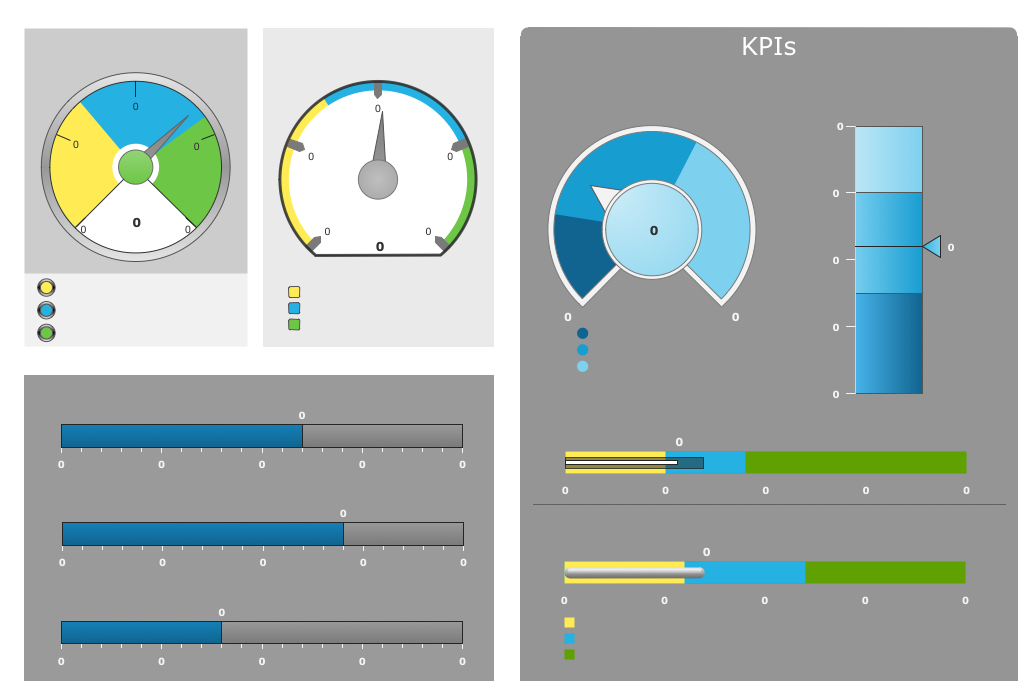
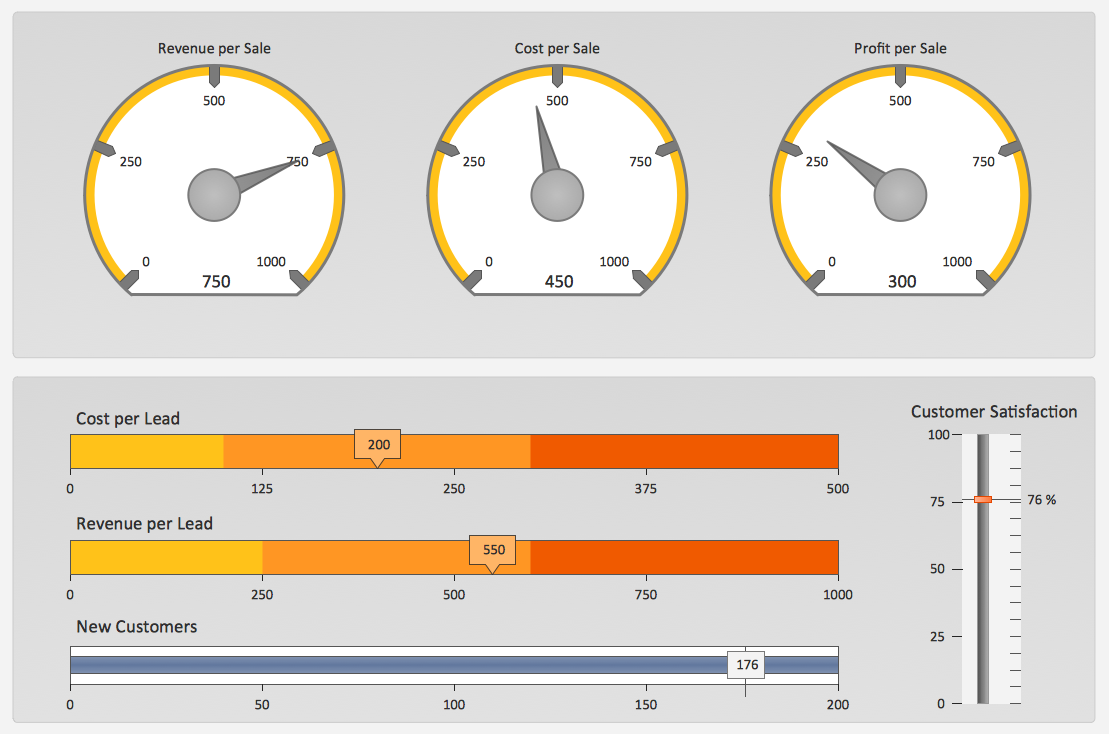
 Sales Dashboard
Sales Dashboard solution extends ConceptDraw DIAGRAM software with templates, samples and library of vector stencils for drawing the visual dashboards of sale metrics and key performance indicators (KPI).
Sales Dashboard Examples
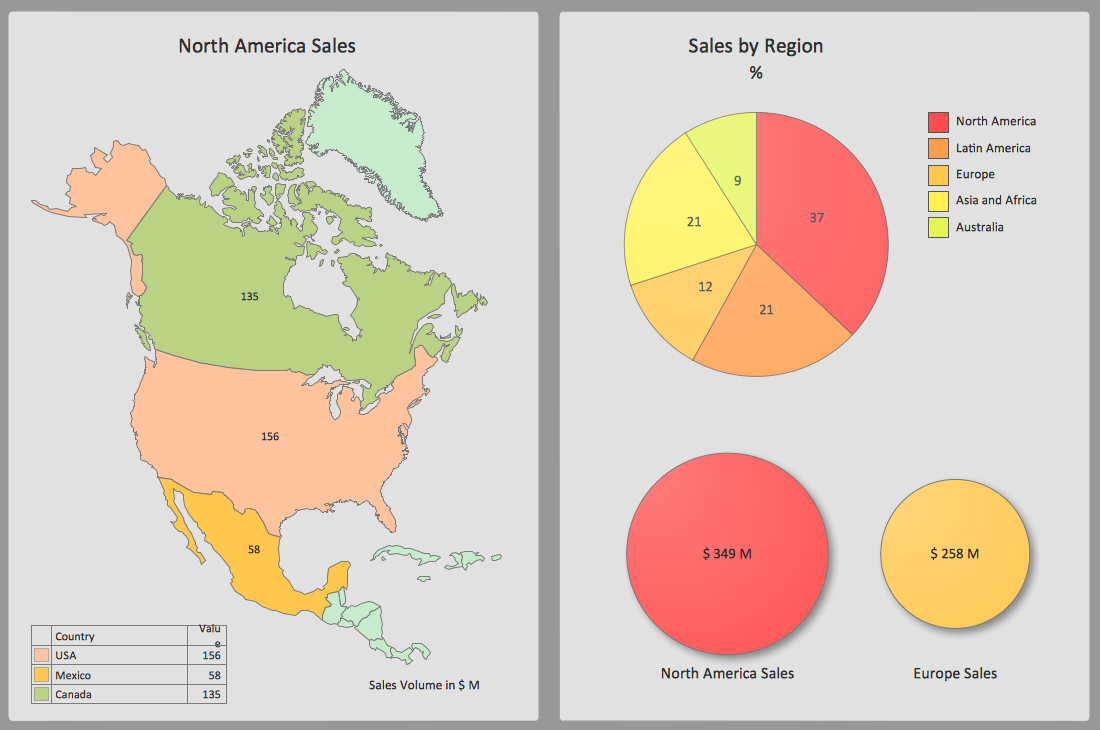
Empower Your Sales Team With a Sales Dashboard
Marketing and Sales Organization chart. Organization chart Example

 Bar Graphs
The Bar Graphs solution enhances ConceptDraw DIAGRAM functionality with templates, numerous professional-looking samples, and a library of vector stencils for drawing different types of Bar Graphs, such as Simple Bar Graph, Double Bar Graph, Divided Bar Graph, Horizontal Bar Graph, Vertical Bar Graph, and Column Bar Chart.
A KPI Dashboard
HelpDesk
How to Create a Picture Graph

Sales Teams are Inherently Competitive
 Line Graphs
How to draw a Line Graph with ease? The Line Graphs solution extends the capabilities of ConceptDraw DIAGRAM with professionally designed templates, samples, and a library of vector stencils for drawing perfect Line Graphs.
- Sales Growth. Bar Graphs Example | Bar Diagrams for Problem ...
- Sales Growth. Bar Graphs Example | Bar Chart Examples | Financial ...
- Bar Graphs | Sales Growth. Bar Graphs Example | Bar Graph | A ...
- Sales Growth. Bar Graphs Example | Sales KPIs and Metrics - Vector ...
- Chart Maker for Presentations | Sales Growth. Bar Graphs Example ...
- Bar Graphs | Sales Growth. Bar Graphs Example | Bar Graph | Bar ...
- Sales Growth. Bar Graphs Example | Bar Graphs | Bar Chart ...
- Polar Graph | Sales Growth. Bar Graphs Example | Picture Graph ...
- Sample Of Marketing Sales Chart
- Sales Growth. Bar Graphs Example | Event-driven Process Chain ...
- Create Graphs and Charts | Sales Growth. Bar Graphs Example ...
- Bar Chart Examples | Sales Growth. Bar Graphs Example | Financial ...
- Sales Growth. Bar Graphs Example | Create Graphs and Charts ...
- Bar Graphs | Sales Growth. Bar Graphs Example | How to Create a ...
- Sales Growth. Bar Graphs Example | Bar Graphs | Divided Bar ...
- Sales Growth. Bar Graphs Example | Create Graphs and Charts ...
- Sales Growth. Bar Graphs Example | What Is a Picture Graph ...
- Sales Growth. Bar Graphs Example | Bar Chart Template for Word ...
- Sales Growth. Bar Graphs Example | Revenue Growth Graph
- Sales Growth. Bar Graphs Example | Bar Chart Examples | Bar ...