This site uses cookies. By continuing to browse the ConceptDraw site you are agreeing to our Use of Site Cookies.
HelpDesk

How to Add and Edit Connector Text

ConceptDraw DIAGRAM gives you some tools for connecting shapes: Direct Connectors, Smart, Arc, Bezier, Curve and Round Connectors. Direct Connectors are direct lines from the point to the point. Smart, Arc, Bezier, Curve and Round Connectors are almost the same as Direct Connectors. However, they automatically move around other objects. You can use Chain, or Tree connection mode for connection of multiple objects with any type of connectors. ConceptDraw DIAGRAM allows you to add and move text on a connector the same way that you add and move text on other any object.

Emergency Plan

Fire emergency plan need to be in every building on each floor. The evacuation plan preliminary designed in ConceptDraw DIAGRAM software will help employees or family members when natural disasters, fires, hazardous leaks and other disaster events happen. Start drawing emergency blueprint from floor bounds, then put the inner walls and doors, and finally use arrows to show evacuation directions to fire exits.
How to Draw a Floor Plan

ConceptDraw Arrows10 Technology

You can see that when you rotate a group, connectors change their angle, keeping their position inside of the grouped objects. If you decide to ungroup the objects, the connectors will adjust to keep lines parallel to the edges of the sheet.

The magic of ConceptDraw Arrows10’s rotating group containing connectors, makes complex diagramming simple and easy.

The way to connect objects has never been easier.

ConceptDraw Arrows10 Technology

You can use text with any conceptDraw connectors to describe relationships between objects.

Add text to connectors the same way you add text to any object - doubleclick a connector and type.

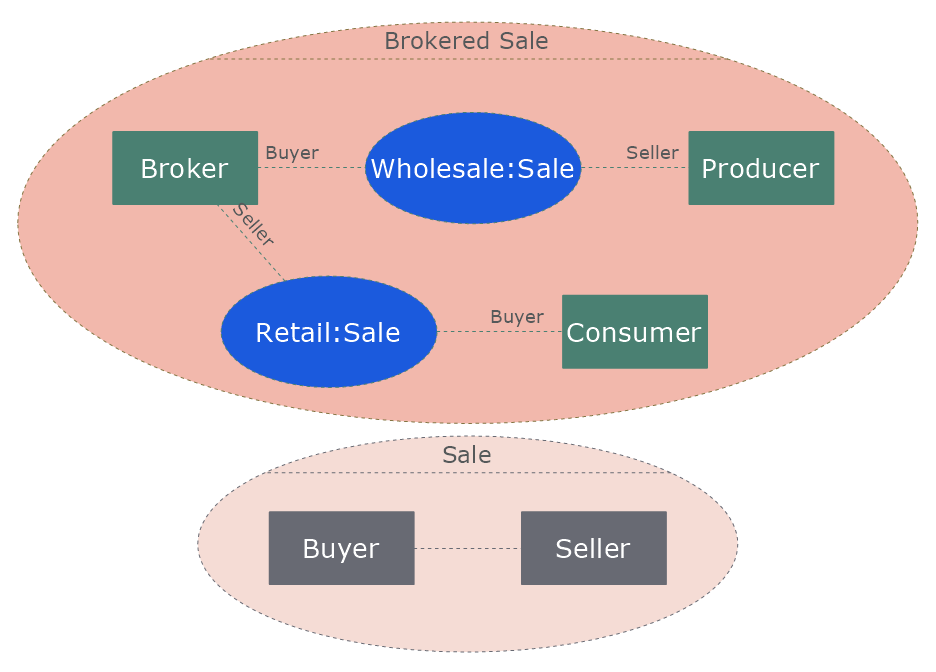
ERD Symbols and Meanings

Crow's foot notation is used in Barker's Notation, Structured Systems Analysis and Design Method (SSADM) and information engineering. Crow's foot diagrams represent entities as boxes, and relationships as lines between the boxes. Different shapes at the ends of these lines represent the cardinality of the relationship.
The Chen's ERD notation is still used and is considered to present a more detailed way of representing entities and relationships.
To create an ERD, software engineers mainly turn to dedicated drawing software, which contain the full notation resources for their specific database design - ERD symbols and meanings. CS Odessa has released an all-inclusive Entity-Relationship Diagram (ERD) solution for their powerful drawing program, ConceptDraw DIAGRAM.
How to Build an Entity Relationship Diagram (ERD)
HelpDesk

How to Edit Grouped Objects on PC

ConceptDraw DIAGRAM allows one to group objects. Grouping shapes, pictures, or objects lets you style, format, rotate, and move them together, as though they were a single object. At the same time, you can edit each of them separately.
HelpDesk

How to Edit Grouped Objects on Mac
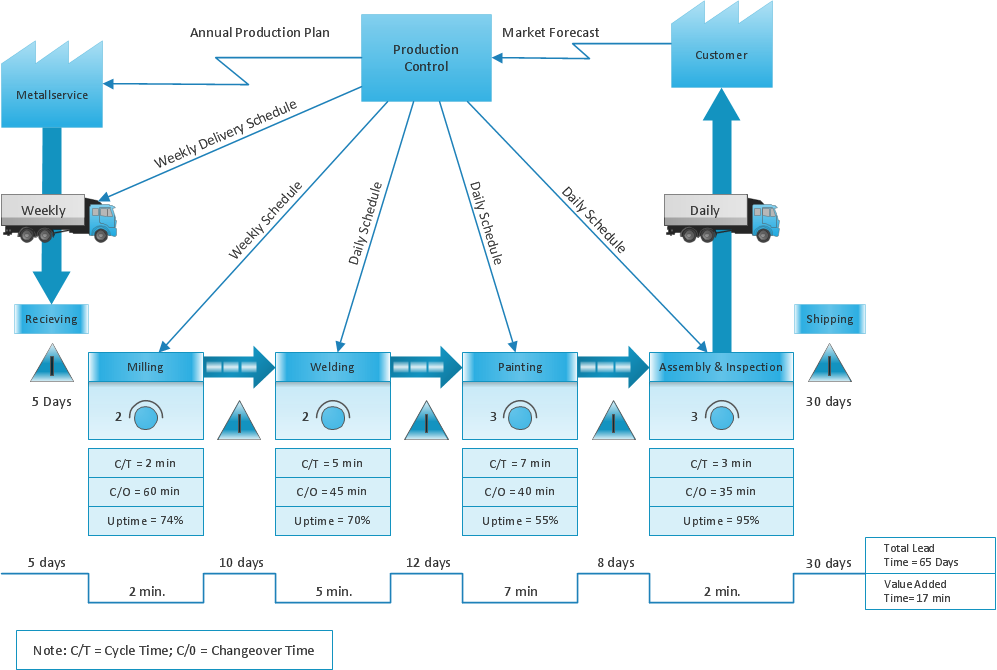
ConceptDraw DIAGRAM offers a range of built-in facilities in order to enable you to quickly edit any diagram or other visualization made using ConceptDraw DIAGRAM, or MS Visio. Grouping shapes, pictures, or objects lets you style, format, rotate, and move them together, as though they were a single object.

Data Flow Diagram

Data flow diagram (DFD) is the part of the SSADM method (Structured Systems Analysis and Design Methodology), intended for analysis and information systems projection. Data flow diagrams are intended for graphical representation of data flows in the information system and for analysis of data processing during the structural projection. Data flow diagram often used in connection with human process and can be displayed as workflow diagram. The critical Process Flow Diagram is another flowchart technique for designing data flow in connection with organizational processes. The critical Process flow diagram may use different range of symbols than a classic workflow diagram.

Business Process Workflow Diagram

Business Process Workflow Diagram is a professional visual tool that is widely applied for business development, business analysis, business process optimization and documenting business processes. Business Process Workflow Diagram lets depict in details the steps of business processes and flow of tasks between them, the execution of business processes, transfer of data and documents.
The workflows on the Business Process Workflow Diagram are represented using the set of common symbols which let easy illustrate business processes and process flows, depict the start, all major steps and end of the process, what data are used by the process, how the data flow through the business areas within scope of our project, how the tasks are executed and by who, and how workers interact with each other.
How to Draw Business Process Diagrams

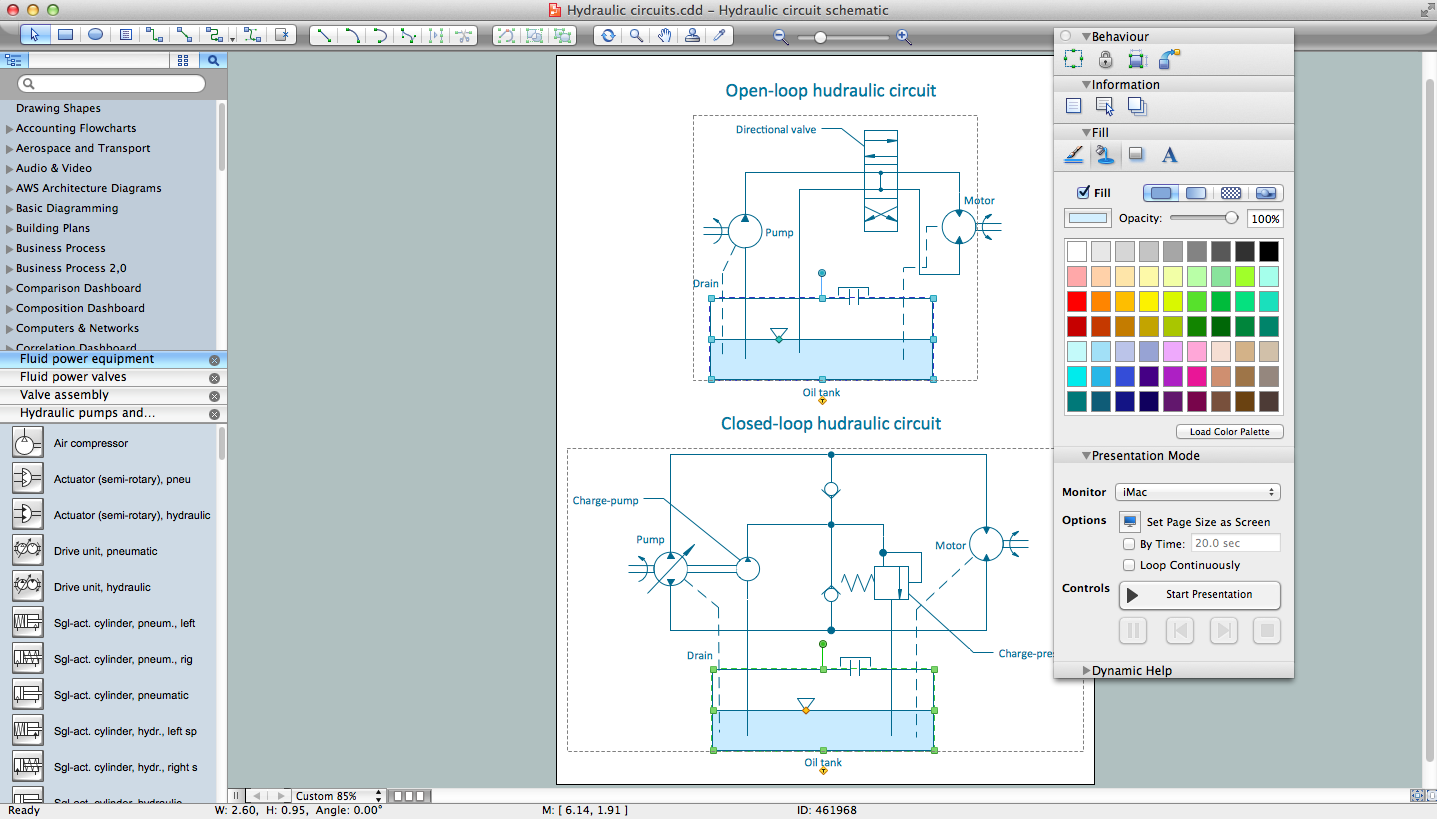
Technical Drawing Software

Science and technology rapidly develop in the modern world. Electronic devices, computers and various software are very popular now. The technical drawing software is already necessity today. ConceptDraw DIAGRAM is new software for business and technical drawing. It offers a powerful tools for all kinds of technical drawing with pre-drawn shapes, free samples of business drawings and flowcharts, support for many graphic formats enables users to visually develop their technical drawings charts, schematics and diagrams in any combination of drawings, diagrams and flow charts.