CORRECTIVE ACTIONS PLANNING. Risk Diagram (PDPC)
 - Health care")

This example was redesigned from the Wikimedia Commons file: Example of High Level Fault Tree.jpg. [commons.wikimedia.org/ wiki/ File:Example_ of_ High_ Level_ Fault_ Tree.jpg]
"Risk assessment is the determination of quantitative or qualitative value of risk related to a concrete situation and a recognized threat (also called hazard). Quantitative risk assessment requires calculations of two components of risk (R):, the magnitude of the potential loss (L), and the probability (p) that the loss will occur. Acceptable risk is a risk that is understood and tolerated usually because the cost or difficulty of implementing an effective countermeasure for the associated vulnerability exceeds the expectation of loss.
In all types of engineering of complex systems sophisticated risk assessments are often made within Safety engineering and Reliability engineering when it concerns threats to life, environment or machine functioning. The nuclear, aerospace, oil, rail and military industries have a long history of dealing with risk assessment. Also, medical, hospital, social service and food industries control risks and perform risk assessments on a continual basis. Methods for assessment of risk may differ between industries and whether it pertains to general financial decisions or environmental, ecological, or public health risk assessment." [Risk assessment. Wikipedia]
The FTA diagram example "High level fault tree" was created using the ConceptDraw PRO diagramming and vector drawing software extended with the Fault Tree Analysis Diagrams solution from the Engineering area of ConceptDraw Solution Park.
FTA diagram

The FTA diagram sample "Fault tree analysis - Insulin delivery system" was redesigned from the illustration of "CMSI 641: Introduction to Software Engineering. Design of Critical Systems. B.J. Johnson. 2005. Loyola Marymount University".
"Another way of assessing hazards is using fault tree analysis. In this process, each of the identified hazards is covered by a detailed analysis to find out what might cause it. Either inductive or deductive reasoning is applied. In the case of software hazards, the usual focus is to determine faults that will cause the system to fail to deliver a system service, such as a monitoring system. A "fault tree" is constructed to link all the possible situations together, to help identify the interrelationships of the failures, which modules may cause them, and what "trickle-down effects" there might be. Here is an example of a fault tree, as applied to the Insulin delivery system from Sommerville...
Note that this tree is only partially complete, since only the potential software faults are shown on the diagram. The potential failures involving hardware, such as low battery, blood monitor or sensor failure, patient over-exertion or inattention, or medical staff failure are noticeable by their absence.
The fault tree and safety specification processes are two ways of helping with system risk assessment tasks. Once the risks are identified, there are other assessments that need to take place. First, the likelihood of the risk occurrance must be assessed. This is often quantifiable, so numbers may be assigned based on things like MTBF, latency effects, and other known entities. There may be other non-quantifiable contributors to the risk likelihood, however, such that these must be assessed and estimated by experts in the domain. (Don't short-change this process when dealing with critical systems!) Finally, the risk assessment must include the severity of the risk, meaning an estimation of the cost to the project in the event the risk item actually does occur. "Cost to the project" means all associated costs, including schedule delays, human injury, damage to hardware, corruption of data, and so on."
[myweb.lmu.edu/ bjohnson/ cmsi641web/ week15-2.html]
The FTA diagram example "Fault tree analysis - Insulin delivery system" was created using the ConceptDraw PRO diagramming and vector drawing software extended with the Fault Tree Analysis Diagrams solution from the Engineering area of ConceptDraw Solution Park.
FTA diagram

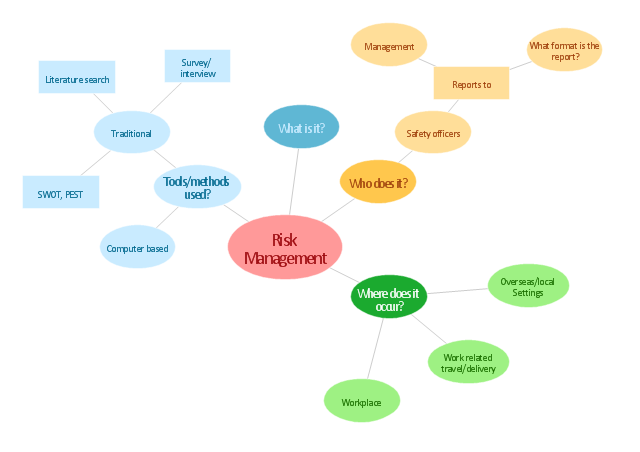
"Risk management is the identification, assessment, and prioritization of risks (defined in ISO 31000 as the effect of uncertainty on objectives, whether positive or negative) followed by coordinated and economical application of resources to minimize, monitor, and control the probability and/ or impact of unfortunate events or to maximize the realization of opportunities. Risks can come from uncertainty in financial markets, threats from project failures (at any phase in design, development, production, or sustainment life-cycles), legal liabilities, credit risk, accidents, natural causes and disasters as well as deliberate attack from an adversary, or events of uncertain or unpredictable root-cause. ... Methods, definitions and goals vary widely according to whether the risk management method is in the context of project management, security, engineering, industrial processes, financial portfolios, actuarial assessments, or public health and safety.
The strategies to manage threats (uncertainties with negative consequences) typically include transferring the threat to another party, avoiding the threat, reducing the negative effect or probability of the threat, or even accepting some or all of the potential or actual consequences of a particular threat, and the opposites for opportunities (uncertain future states with benefits)." [Risk management. Wikipedia]
The concept map example "Risk management" was created using the ConceptDraw PRO diagramming and vector drawing software extended with the Concept Maps solution from the area "What is a Diagram" of ConceptDraw Solution Park.
Concept map
Sales Process Flowchart Symbols

Internal Audit Process

ConceptDraw PRO diagramming and vector drawing software extended with Audit Flowcharts solution from the Finance and Accounting area perfectly suits for the Internal Audit Process. You can make sure this right now!
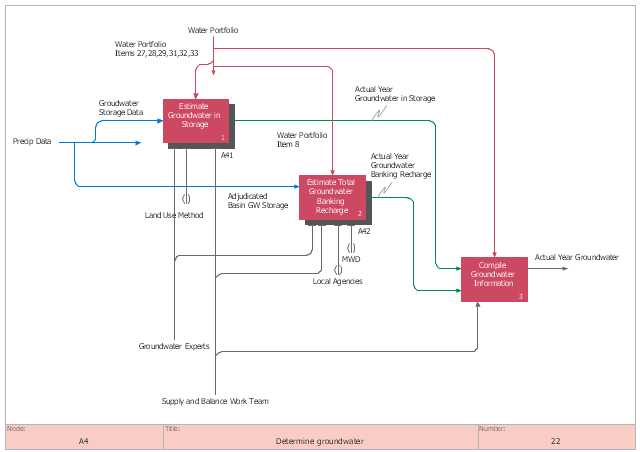
This IDEF0 diagram sample was created on the base of the figure from the California Water Plan website. [waterplan.water.ca.gov/ technical/ cwpu2009/ flowdiaghtml/ dgm18.htm]
"The California Water Plan provides a collaborative planning framework for elected officials, agencies, tribes, water and resource managers, businesses, academia, stakeholders, and the public to develop findings and recommendations and make informed decisions for California's water future. The plan, updated every five years, presents the status and trends of California's water-dependent natural resources; water supplies; and agricultural, urban, and environmental water demands for a range of plausible future scenarios. The California Water Plan also evaluates different combinations of regional and statewide resource management strategies to reduce water demand, increase water supply, reduce flood risk, improve water quality, and enhance environmental and resource stewardship. The evaluations and assessments performed for the plan help identify effective actions and policies for meeting California's resource management objectives in the near term and for several decades to come." [waterplan.water.ca.gov]
The IDEF0 diagram example "Determine groundwater" was created using the ConceptDraw PRO diagramming and vector drawing software extended with the IDEF0 Diagrams solution from the Software Development area of ConceptDraw Solution Park.
IDEF0 diagram
Network Security Devices

Competitor Analysis

- CORRECTIVE ACTIONS PLANNING. Risk Diagram (PDPC) | How ...
- CORRECTIVE ACTIONS PLANNING. Risk Diagram (PDPC) | Risk ...
- Fault Tree Analysis Software | Value Stream Mapping | Process ...
- High level fault tree | Event Tree Analysis Of Hospital
- Audit failure - Fault tree analysis diagram | Design elements - Fault ...
- Risk Analysis | CORRECTIVE ACTIONS PLANNING. Risk Diagram ...
- Fault Tree Analysis Software | Design elements - Fault tree analysis ...
- CORRECTIVE ACTIONS PLANNING. Risk Diagram (PDPC) | Risk ...
- CORRECTIVE ACTIONS PLANNING. Risk Diagram (PDPC) | How ...
- What Is A Fault Tree Analysis
- FTA diagram - Hazard analysis | Design elements - Fault tree ...
- Fault Tree Analysis Diagrams
- 5 Level pyramid model diagram - Information systems types | Design ...
- Venn Diagram Examples for Problem Solving. Environmental Social ...
- Fault Tree Analysis Software
- Fault Tree Analysis Diagrams | Root cause analysis tree diagram ...
- Entity-Relationship Diagram (ERD) with ConceptDraw PRO ...
- Fault tree analysis diagrams
- FTA diagram - Hazard analysis | Resources and energy - Vector ...
- Design elements - Fault tree analysis diagrams | Fault Tree Analysis ...