How To Create Project Report

Reporting & Data Visualization

Business Report Pie. Pie Chart Examples

How To Hold Project Collaboration via Skype


Reporting Dashboard Software for Business
HelpDesk
How to Generate ConceptDraw PROJECT Standard Reports on Mac

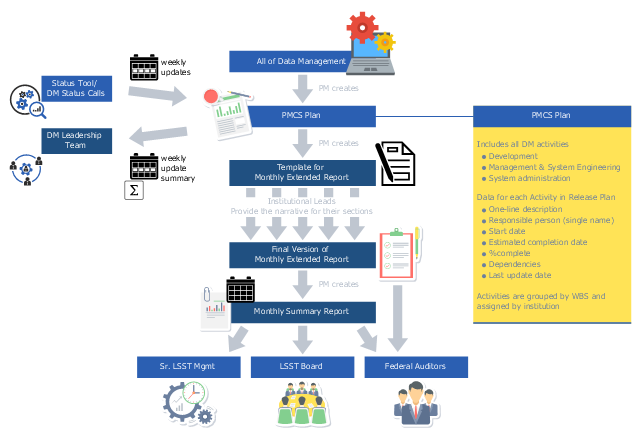
This business infographic sample depicts the project data management reporting system processes. It was designed on the base of the diagram "Weekly Updates and Monthly Reports" from the wiki of the Large Synoptic Survey Telescope (LSST) project.
" The DM project uses the following process for monthly reporting:
1. ... the DM Project Manager maintains data challenge release and management/ system engineering plans in the LSST Project Management Control System (PMCS). Each activity in the plan includes the name of the activity, expected start and end dates, and assignees (with primary/ lead person listed first).
2. The LSST Project provides a web-based tool for weekly status reporting against the plan. The status collected included % complete, actual and expected start and finish dates, and comments."
[dev.lsstcorp.org/ trac/ wiki/ PlanningReportingProcess#DataManagementReportingProcess]
"Data management comprises all the disciplines related to managing data as a valuable resource." [Data management. Wikipedia]
The business infographic example "Data management reporting process" was designed using ConceptDraw PRO diagramming and vector drawing software extended with the Business and Finance solution from Illustration area of ConceptDraw Solution Park.
Infographic
This interactive voice response (IVR) flowchart sample shows the store reporting process flow.
"Call centers use IVR systems to identify and segment callers. The ability to identify customers allows services to be tailored according to the customer profile. The caller can be given the option to wait in the queue, choose an automated service, or request a callback. The system may obtain caller line identification (CLI) data from the network to help identify or authenticate the caller. Additional caller authentication data could include account number, personal information, password and biometrics (such as voice print).
When an IVR system answers multiple phone numbers the use of DNIS ensures that the correct application and language is executed. A single large IVR system can handle calls for thousands of applications, each with its own phone numbers and script.
IVR also enables customer prioritization. In a system wherein individual customers may have a different status the service will automatically prioritize the individual's call and move customers to the front of a specific queue. Prioritization could also be based on the DNIS and call reason." [Interactive voice response. Wikipedia]
The IVR diagram example "Store reporting flowchart" was created using the ConceptDraw PRO diagramming and vector drawing software extended with the Interactive Voice Response Diagrams solution from the Computer and Networks area of ConceptDraw Solution Park.
IVR diagram

How to Report Task's Execution with Gantt Chart

HelpDesk
How to Report on Multiple Projects Status

One formula of professional mind mapping : input data + output data + make great presentation

HelpDesk
How to Use ConceptDraw PROJECT Micro - Reports

HelpDesk
How to Generate ConceptDraw PROJECT Standard Reports on PC

HelpDesk
How to Report on Project Milestones Using a Mind Map

HelpDesk
How to Publish Project Reports on the Web Using ConceptDraw PRO

- How to Report Task's Execution with Gantt Chart | How to Create ...
- Reporting Process Flow Chart
- Financial Reporting Process Flow Chart
- Reporting Flow Chart Template
- Business Report Pie. Pie Chart Examples | Bar Chart Examples ...
- How to Report on Multiple Projects Status | PM Dashboards | PM ...
- How to Report on Project Milestones Using a Mind Map | How To ...
- Organizational Chart Excel How To Do Multiple Reporting Lines
- Business Report Pie. Pie Chart Examples | How to Report Task's ...
- Store reporting flowchart | Interactive Voice Response Diagrams ...
- Reporting & Data Visualization | Data Visualization Software ...
- How to Report on Multiple Projects Status | Project management ...
- Interactive Voice Response Diagrams | Store reporting flowchart ...
- Sales KPI Dashboards | KPIs and Metrics | Reporting Dashboard ...
- How To Create Project Report | How to Report on Multiple Projects ...
- How to Report on Multiple Projects Status | How to Manage Multiple ...
- Store reporting flowchart | Flowchart Of A Biometrics Process
- Store reporting flowchart | Voiceprint Icon
- Process Flowchart | Store reporting flowchart | Basic Flowchart ...
- Store reporting flowchart