Flowchart Marketing Process. Flowchart Examples

Venn Diagram

Pie Donut Chart. Pie Chart Examples

Create Process Flowcharts

CORRECTIVE ACTIONS PLANNING. Involvement Matrix


UML Component for Bank

Spider Chart Template

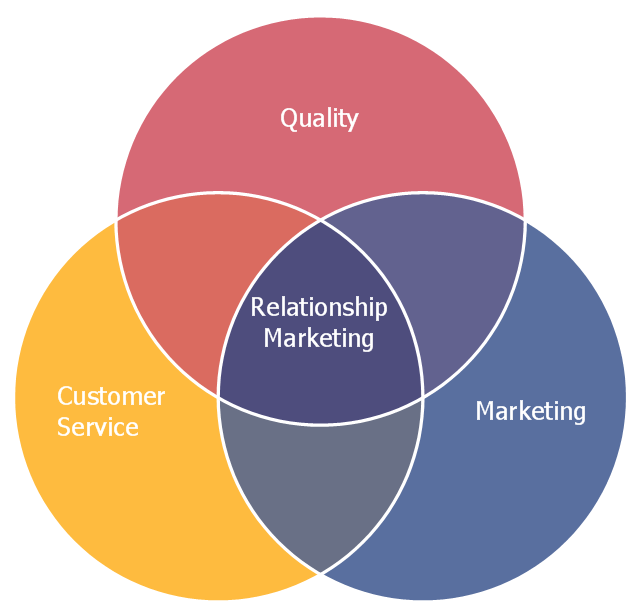
This Venn diagram sample depicts the relationship marketing.
"Relationship marketing was first defined as a form of marketing developed from direct response marketing campaigns which emphasizes customer retention and satisfaction, rather than a dominant focus on sales transactions. As a practice, relationship marketing differs from other forms of marketing in that it recognizes the long term value of customer relationships and extends communication beyond intrusive advertising and sales promotional messages. With the growth of the internet and mobile platforms, relationship marketing has continued to evolve and move forward as technology opens more collaborative and social communication channels. This includes tools for managing relationships with customers that goes beyond simple demographic and customer service data. Relationship marketing extends to include inbound marketing efforts, (a combination of search optimization and strategic content), PR, social media and application development." [Relationship marketing. Wikipedia]
The Venn diagram example "Relationship marketing" was created using the ConceptDraw PRO diagramming and vector drawing software extended with the Basic Venn Diagrams solution from the area "What is a Diagram" of ConceptDraw Solution Park.
Venn diagram
Content Marketing Infographics

Account Flowchart Stockbridge SystemFlowchart Examples
 Create your own flow charts of data processing systems using the ConceptDraw DIAGRAM diagramming and vector drawing software extended with the Cross-Functional Flowcharts solution from the Business Processes area of ConceptDraw Solution Park.
This is a flowchart of a data processing system combining manual and computerized processing to handle accounts receivable, billing, and general ledger.
Create your own flow charts of data processing systems using the ConceptDraw DIAGRAM diagramming and vector drawing software extended with the Cross-Functional Flowcharts solution from the Business Processes area of ConceptDraw Solution Park.
This is a flowchart of a data processing system combining manual and computerized processing to handle accounts receivable, billing, and general ledger.
Basic Diagramming
 Create flowcharts, org charts, shipping flowcharts, floor plans, business diagrams and more with ConceptDraw. Includes 1000s of professional-looking business templates that you can modify and make your own.

Online Flow Chart
 ConceptDraw DIAGRAM diagramming and vector drawing software extended with tools of Flowcharts Solution from the "Diagrams" Area of ConceptDraw Solution Park ideally suits for fast and easy Online Flow Chart designing. We propose to verify this right now.
The Sales Process
 The Sales Process is a complex approach for selling a product or service which assumes many steps including the sales planning, realization of the sales marketing and management strategies, sales process analysis, etc. Now we have a ConceptDraw DIAGRAM software extended with unique Sales Flowcharts solution from the Marketing area of ConceptDraw Solution Park which ideally suits for the planning and realization the company's sales process.
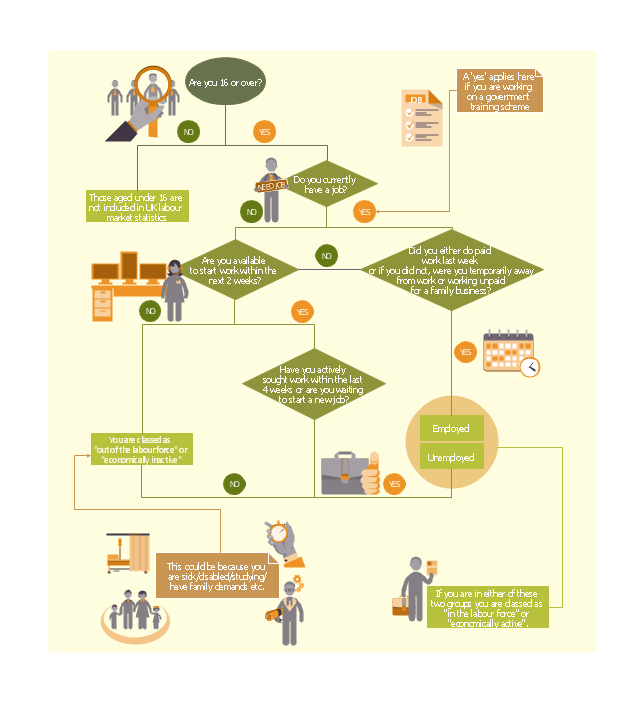
HR flowchart "UK Labour Market Categories" was redesigned from the Wikipedia file: UK Labour Market Categories.png.
The Sales Process is a complex approach for selling a product or service which assumes many steps including the sales planning, realization of the sales marketing and management strategies, sales process analysis, etc. Now we have a ConceptDraw DIAGRAM software extended with unique Sales Flowcharts solution from the Marketing area of ConceptDraw Solution Park which ideally suits for the planning and realization the company's sales process.
HR flowchart "UK Labour Market Categories" was redesigned from the Wikipedia file: UK Labour Market Categories.png.
"Flow chart showing the different categories in the UK labour market such as employed, unemployed and economically inactive." [commons.wikimedia.org/ wiki/ File:UK_ Labour_ Market_ Categories.png]
This file is licensed under the Creative Commons Attribution-Share Alike 3.0 Unported license. [creativecommons.org/ licenses/ by-sa/ 3.0/ ]
"Employment is a relationship between two parties, usually based on a contract, one being the employer and the other being the employee. ...
An employee contributes labor and expertise to an endeavor of an employer and is usually hired to perform specific duties which are packaged into a job. An Employee is a person who is hired to provide services to a company on a regular basis in exchange for compensation and who does not provide these services as part of an independent business. ...
Employer and managerial control within an organization rests at many levels and has important implications for staff and productivity alike, with control forming the fundamental link between desired outcomes and actual processes. Employers must balance interests such as decreasing wage constraints with a maximization of labor productivity in order to achieve a profitable and productive employment relationship." [Employment. Wikipedia]
The HR flow chart example "UK labour market categories" was created using the ConceptDraw PRO diagramming and vector drawing software extended with the HR Flowcharts solution from the Management area of ConceptDraw Solution Park.
HR flowchart
Samples of Flowchart
 This sample shows the Flowchart of the testing the work of the lamp and decision making about what to do to lamp will work.
Examples of Flowcharts, Org Charts and More
 ConceptDraw DIAGRAM covers a broad spectrum of business graphics categories and offers at ConceptDraw STORE enormous online collection of pictorial examples and samples for different thematics and application areas. It is a plentiful source of inspiration and wonderful examples of professionally designed diagrams, flowcharts, UML diagrams, organizational charts, databases, ERDs, network diagrams, business charts, different thematic charts, schematics, infographics and plans developed specially for knowledge workers, engineers, managers, businessmen, marketing specialists, analytics, scientists, students, professors, journalists and also for a large number of other people that every day use various diagrams and drawings in their work and life activity.
Each of these examples is a real art, all they are well thought-out and designed without efforts with help of powerful tools of ConceptDraw DIAGRAM software. ConceptDraw examples display all variety of tasks, possibilities and results that ConceptDraw Product Line lets achieve fast and easy.
ConceptDraw is one of the best Visio alternatives for Mac. It open all Visio formats like.vsdx,.vss,.vdx files and allows you to export files to Visio formats.
ConceptDraw DIAGRAM covers a broad spectrum of business graphics categories and offers at ConceptDraw STORE enormous online collection of pictorial examples and samples for different thematics and application areas. It is a plentiful source of inspiration and wonderful examples of professionally designed diagrams, flowcharts, UML diagrams, organizational charts, databases, ERDs, network diagrams, business charts, different thematic charts, schematics, infographics and plans developed specially for knowledge workers, engineers, managers, businessmen, marketing specialists, analytics, scientists, students, professors, journalists and also for a large number of other people that every day use various diagrams and drawings in their work and life activity.
Each of these examples is a real art, all they are well thought-out and designed without efforts with help of powerful tools of ConceptDraw DIAGRAM software. ConceptDraw examples display all variety of tasks, possibilities and results that ConceptDraw Product Line lets achieve fast and easy.
ConceptDraw is one of the best Visio alternatives for Mac. It open all Visio formats like.vsdx,.vss,.vdx files and allows you to export files to Visio formats.
 What is ConceptDraw OFFICE
Line Chart Template for Word
 This sample was created in ConceptDraw DIAGRAM diagramming and vector drawing software using the Line Graphs Solution from Graphs and Charts area of ConceptDraw Solution Park.
This sample shows the Line Chart of annual percentage change. The Line Chart allows you to clearly see the changes of data over the time.
This sample was created in ConceptDraw DIAGRAM diagramming and vector drawing software using the Line Graphs Solution from Graphs and Charts area of ConceptDraw Solution Park.
This sample shows the Line Chart of annual percentage change. The Line Chart allows you to clearly see the changes of data over the time.
Good Flow Chart app for Mac
 The ConceptDraw DIAGRAM is a good flow chart app for Mac. Numerous vector stencils, samples and templates created by designers allows you to draw any type of flowchart.
Process Flow Chart Software Free
 How to draw a Process Flow Chart? It's very fast and easy to draw any Process Flow Chart using the tools of special Process Flow Chart software free.
Flowcharts Solution offers wide set of useful drawing tools, collection of samples, ready-to-use template and 2 libraries with predesigned vector elements which will help facilitate drawing process and designing professional looking process flow chart, process flow scheme, process block diagram, etc.
How to draw a Process Flow Chart? It's very fast and easy to draw any Process Flow Chart using the tools of special Process Flow Chart software free.
Flowcharts Solution offers wide set of useful drawing tools, collection of samples, ready-to-use template and 2 libraries with predesigned vector elements which will help facilitate drawing process and designing professional looking process flow chart, process flow scheme, process block diagram, etc.
Six Markets Model Chart
 This sample shows the Six Markets Model Chart. It was created in ConceptDraw DIAGRAM diagramming and vector drawing software using the Marketing Diagrams Solution from the Marketing area of ConceptDraw Solution Park.
The six markets model defines six markets that take the central place in the relationship marketing: internal markets, supplier markets, recruitment markets, referral markets, influence markets and customer markets. The six markets model allows the organization to analyze the stakeholders and key market domains that can be important to it. This model used in marketing project management software for small business project management.
This sample shows the Six Markets Model Chart. It was created in ConceptDraw DIAGRAM diagramming and vector drawing software using the Marketing Diagrams Solution from the Marketing area of ConceptDraw Solution Park.
The six markets model defines six markets that take the central place in the relationship marketing: internal markets, supplier markets, recruitment markets, referral markets, influence markets and customer markets. The six markets model allows the organization to analyze the stakeholders and key market domains that can be important to it. This model used in marketing project management software for small business project management.
Flowchart Examples
Create your own flow charts of data processing systems using the ConceptDraw DIAGRAM diagramming and vector drawing software extended with the Cross-Functional Flowcharts solution from the Business Processes area of ConceptDraw Solution Park.
This is a flowchart of a data processing system combining manual and computerized processing to handle accounts receivable, billing, and general ledger.
Basic Diagramming
Online Flow Chart
The Sales Process
HR flowchart "UK Labour Market Categories" was redesigned from the Wikipedia file: UK Labour Market Categories.png.
"Flow chart showing the different categories in the UK labour market such as employed, unemployed and economically inactive." [commons.wikimedia.org/ wiki/ File:UK_ Labour_ Market_ Categories.png]
This file is licensed under the Creative Commons Attribution-Share Alike 3.0 Unported license. [creativecommons.org/ licenses/ by-sa/ 3.0/ ]
"Employment is a relationship between two parties, usually based on a contract, one being the employer and the other being the employee. ...
An employee contributes labor and expertise to an endeavor of an employer and is usually hired to perform specific duties which are packaged into a job. An Employee is a person who is hired to provide services to a company on a regular basis in exchange for compensation and who does not provide these services as part of an independent business. ...
Employer and managerial control within an organization rests at many levels and has important implications for staff and productivity alike, with control forming the fundamental link between desired outcomes and actual processes. Employers must balance interests such as decreasing wage constraints with a maximization of labor productivity in order to achieve a profitable and productive employment relationship." [Employment. Wikipedia]
The HR flow chart example "UK labour market categories" was created using the ConceptDraw PRO diagramming and vector drawing software extended with the HR Flowcharts solution from the Management area of ConceptDraw Solution Park.
HR flowchart
Samples of Flowchart
Examples of Flowcharts, Org Charts and More
Line Chart Template for Word
Good Flow Chart app for Mac
Process Flow Chart Software Free
Six Markets Model Chart
- Relationship marketing | Venn diagram | Block diagram
- Relationship marketing | Customer Relationship Management | Six ...
- Relationship marketing | Six Markets Model Chart | Venn Diagram ...
- Basic Venn Diagrams | Show The Diagram Of Relationship Marketing
- Venn Diagram | Venn Diagrams | Entity- Relationship Diagram (ERD ...
- Venn diagram - Relationship marketing | Block diagram - Six ...
- Relationship marketing | Six Markets Model Chart | Leaky bucket ...
- Entity Relationship Diagram Symbols | Relationship Marketing Digram
- Six Markets Model Chart | Chart Of Relationship Marketing