Winter Sports. Olympic Games Infographics. Medal Table

Advanced printing in ConceptDraw Project

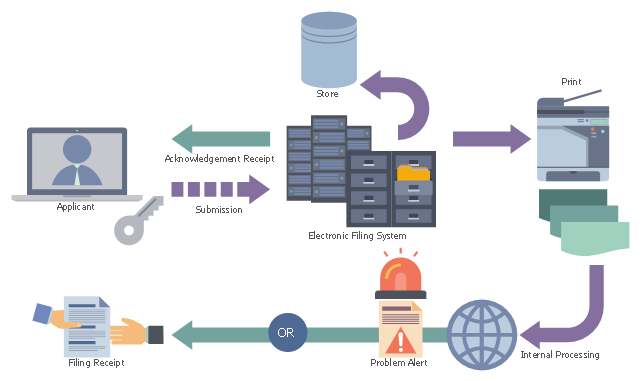
This example was designed on the base of the "Diagram of New Application Workflow" from the United States Patent and Trademark Office (USPTO) website. [uspto.gov/ images/ legalefs1.jpg]
"A nonprovisional application for a patent is made to the Director of the United States Patent and Trademark Office and includes:
(1) A written document which comprises a specification (description and claims);
(2) Drawings (when necessary);
(3) An oath or declaration; and
(4) Filing, search, and examination fees." [uspto.gov/ patents-getting-started/ general-information-concerning-patents#heading-12]
The diagram example "New application workflow" was created using ConceptDraw PRO software extended with the Business Process Workflow Diagrams solution from the Business Processes area of ConceptDraw Solution Park.
Business process flow diagram
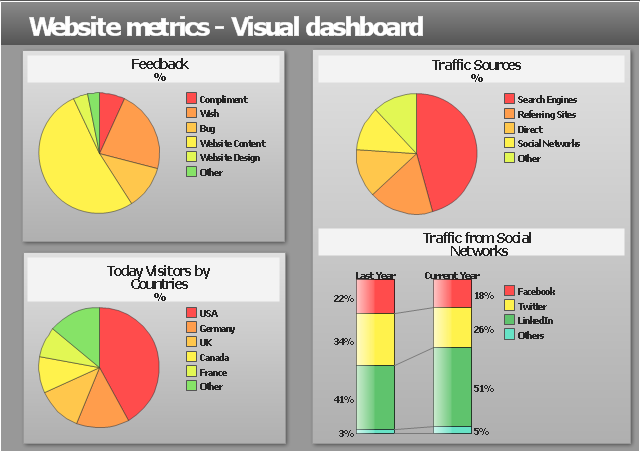
"Web analytics is the measurement, collection, analysis and reporting of internet data for purposes of understanding and optimizing web usage.
Web analytics is not just a tool for measuring web traffic but can be used as a tool for business and market research, and to assess and improve the effectiveness of a web site. Web analytics applications can also help companies measure the results of traditional print or broadcast advertising campaigns. It helps one to estimate how traffic to a website changes after the launch of a new advertising campaign. Web analytics provides information about the number of visitors to a website and the number of page views. It helps gauge traffic and popularity trends which is useful for market research.
There are two categories of web analytics; off-site and on-site web analytics.
Off-site web analytics refers to web measurement and analysis regardless of whether you own or maintain a website.
On-site web analytics measure a visitor's behavior once on your website. This includes its drivers and conversions; for example, the degree to which different landing pages are associated with online purchases. On-site web analytics measures the performance of your website in a commercial context. This data is typically compared against key performance indicators for performance, and used to improve a web site or marketing campaign's audience response." [Web analytics. Wikipedia]
The example "Website metrics - Visual dashboard" was created using the ConceptDraw PRO diagramming and vector drawing software extended with the Composition Dashboard solution from the area "What is a Dashboard" of ConceptDraw Solution Park.
Visual dashboard
Winter Sports. Illustrations and Visualize Statistics

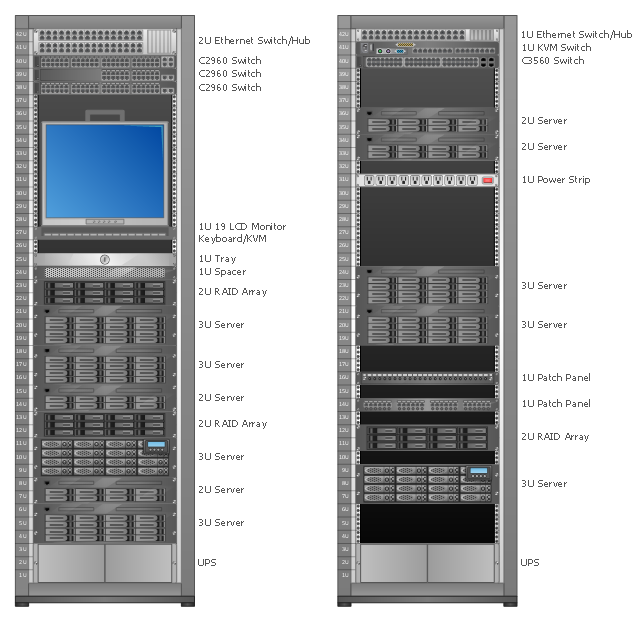
Rack Diagrams visualize the rack mounting of computer hardware and network equipment as the drawing of frontal view of the rack with equipment installed.
They are used for choosing the equipment or racks to buy, and help to organize equipment on the racks virtually, without the real installation.
"A server is a system (software and suitable computer hardware) that responds to requests across a computer network to provide, or help to provide, a network service. Servers can be run on a dedicated computer, which is also often referred to as "the server", but many networked computers are capable of hosting servers. In many cases, a computer can provide several services and have several servers running. ...
Servers often provide essential services across a network, either to private users inside a large organization or to public users via the Internet. Typical computing servers are database server, file server, mail server, print server, web server, gaming server, application server..." [Server (computing). Wikipedia]
This network server rack diagram example was created using the ConceptDraw PRO diagramming and vector drawing software extended with the Rack Diagrams solution from the Computer and Networks area of ConceptDraw Solution Park.
Rack diagram
Business diagrams & Org Charts with ConceptDraw PRO


Basketball Illustrations

Informative and Well-Designed Infographics

Winter Sports Vector Clipart. Medal Map. Spatial Infographics

Flow Chart for Olympic Sports

Football – 2014 FIFA World Cup Standings Group

Basic Flowchart Symbols and Meaning


Contoh Flowchart

- Digital video | TV, Photo and Video - Vector stencils library | How To ...
- Web Server Diagrams
- How To create Diagrams for Amazon Web Services architecture ...
- Diagramming Software for Design UML Collaboration Diagrams ...
- Rack Diagrams | Server hardware - Rack diagram | Rack diagrams ...
- Server hardware - Rack diagram | Network diagrams with ...
- Web Server And Application Server Architecture Diagram
- Design elements - Media | Audio, Video, Media | How To Print Audio ...
- Website Wireframe | Wireframing | Design elements - Wireframe grid ...
- Website metrics - Visual dashboard
- Server hardware - Rack diagram | Diagramming Software for Design ...
- 960 Grid System 16-column layout | Design elements - Wireframe ...
- Examples Of Web Server Diagram
- AWS Architecture Diagrams | Diagramming tool - Amazon Web ...
- Primary Health Center Plan Blue Print
- Web Server Application Server Architecture Diagram
- ConceptDraw | Press Releases
- Website Wireframe | Photo gallery webpage (wireframe) | Wireframe ...
- Entity-Relationship Diagram (ERD) | Cloud Computing Diagrams ...
- How to Print an Outline Directly From Mind Map | Geo Mapping ...