This site uses cookies. By continuing to browse the ConceptDraw site you are agreeing to our Use of Site Cookies.

How to do presentation of Mind Maps via Skype conference call?

Tools to do presentation of mindmaps via Skype.

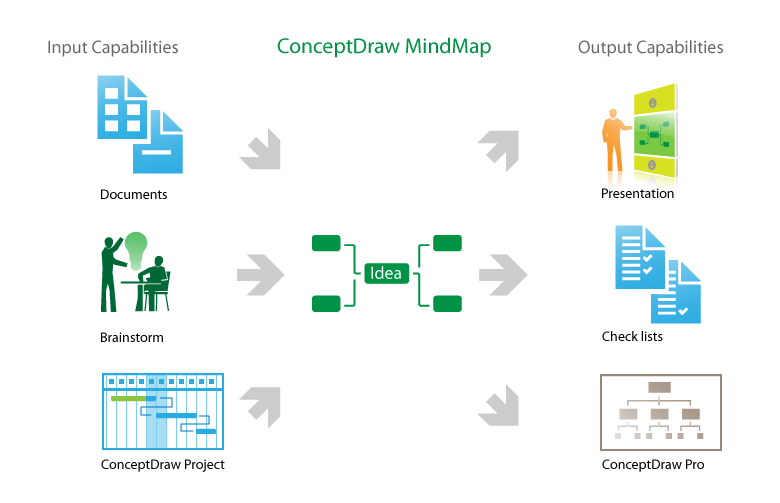
Chart Software for Better Presentations

Easy charting software comes with beautiful chart templates and examples. This makes it easy to create professional charts without prior experience.
Graphs and Charts Area provide a wide collection of professional looking predesigned templates, samples and ready-to-use vector stencils that will help you to draw the charts and diagrams of various types: Pie Charts, Donut Charts, Line Charts, Column Charts, Bar Charts, Pyramids, Scatter Charts, Venn Diagrams, Spider Charts, Area Charts, Divided Bar Graphs.

Basic Diagramming

Perfect charts and graphics diagramming software with rich examples and template. ConceptDraw is ideal to draw Charts and Graphics.

Visual Presentations Made Easy with Diagramming Software

Automatically create a presentation-quality diagram in one click with ConceptDraw DIAGRAM.

Best Vector Drawing Application for Mac OS X
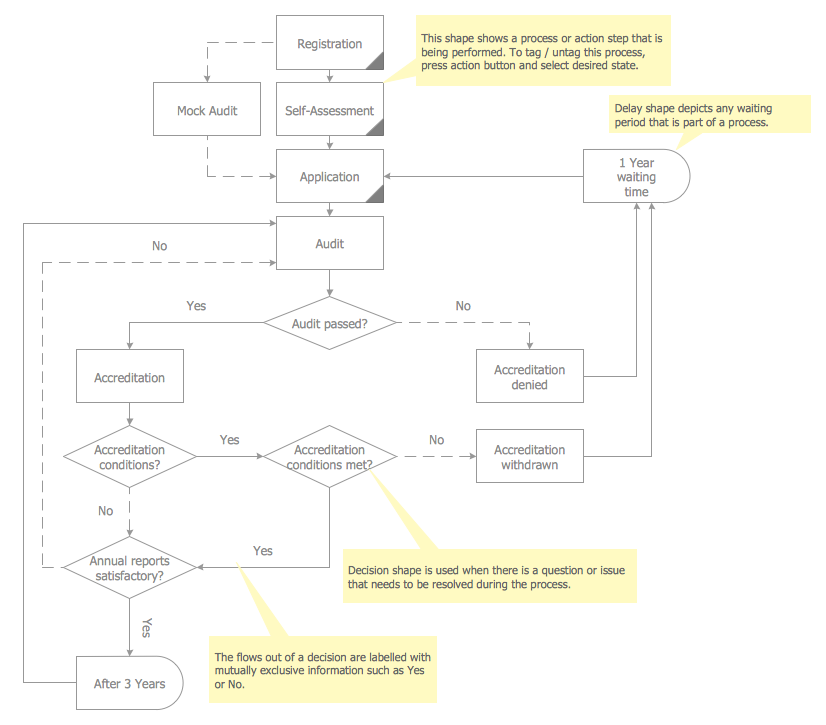
ConceptDraw DIAGRAM creates drawings, diagrams and charts with great visual appeal in Mac OS X.

Audit Steps

Audit Steps - The auditing process is an independent examination of data, statements, operations, records, financial or otherwise performances of an enterprise for any stated purpose. It is a complex process that includes 10 audit steps: Notification, Planning, Opening Meeting, Fieldwork, Communication, Draft Audit, Management Response, Final Meeting, Report Distribution, Feedback.

Export from ConceptDraw MINDMAP to PowerPoint® Presentation

ConceptDraw MINDMAP extended with Presentation Exchange solution allows you to create a traditional PowerPoint Presentation from your mind maps.
Mind Map Exporting <br>to MS PowerPoint
Mind Map Exporting
to MS PowerPoint

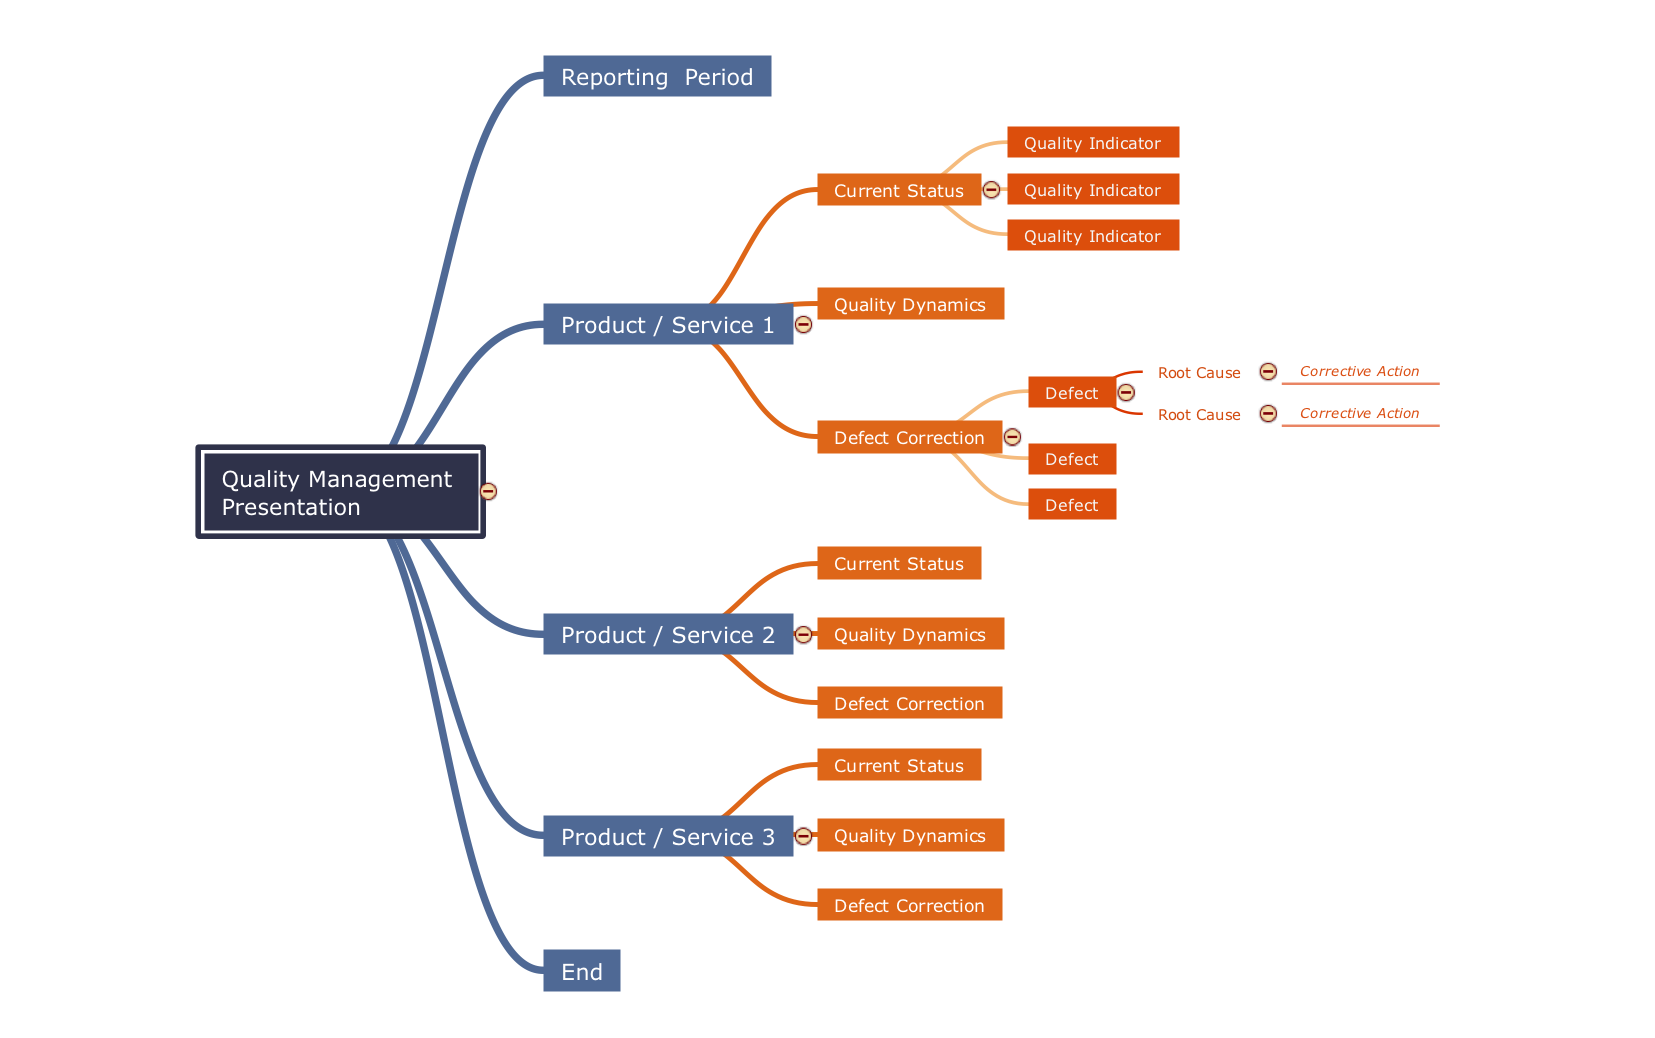
Fundamental Tool in Quality Management

ConceptDraw MINDMAP is a fundamental tool in quality management to describe visual instructions on any process.

Simple Drawing Applications for Mac

ConceptDraw gives the ability to draw simple diagrams like flowcharts, block diagrams, bar charts, histograms, pie charts, divided bar diagrams, line graphs, area charts, scatter plots, circular arrows diagrams, Venn diagrams, bubble diagrams, concept maps, and others.

Amazon Web Services Diagrams diagramming tool for architecture

The AWS Architecture Diagrams solution includes icons, sample and templates for several Amazon Web Services products and resources, to be used when creating architecture diagrams. The icons are designed to be simple so that you can easily incorporate them in your diagrams and put them in your whitepapers, presentations, datasheets, posters or any technical material you like. Here you will find an official collection of AWS resources that will help you build great AWS Architecture diagrams.

How to Create Presentation of Your Project Gantt Chart

During the planning, discussing and execution of a project you may need to prepare a presentation using project views such as the Gantt Chart, Multiproject Dashboard or Resource Usage View. It’s easy do with ConceptDraw PROJECT!

Presenting Documents with Skype

Presentation tools. A convenient tool to present documents via Skype. Share your desktop, collaborate on documents in real-time and run a web conference one-on-one or one-to-many.

A tool for sharing and presenting business documents via Skype. Allows to present Microsoft® Word®, Microsoft PowerPoint®, Microsoft Project® and plenty mindmapping formats.

Basic Diagramming

ConceptDraw DIAGRAM with the specific tools you need to easily draw flowcharts, block diagrams, bar charts, histograms, pie charts, divided bar diagrams, line graphs, area charts, scatter plots, circular arrows diagrams, Venn diagrams, bubble diagrams, concept maps, electrical circuit diagrams, schematics,and others.
Use Basic Diagramming solution to draw you own diagrams, charts and graphs for graphic communication, explanation of business and personal ideas and concepts, simple visual presentation of numerical data, complex structures, logical relations, step-by-step flows of actions or operations.
HelpDesk

How to Add a Block Diagram to a PowerPoint Presentation
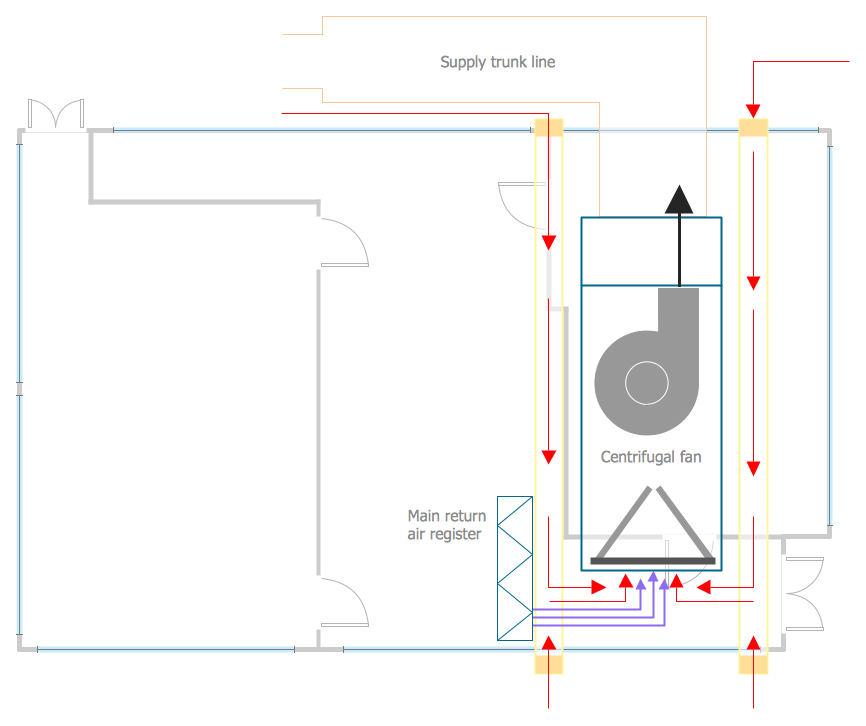
Block diagram is a rather universal type of charts - compositions from geometric blocks can be applied to describe various kinds of processes or systems, consisting of components, which depend on each other. Block diagrams are indispensable when you need to represent a processor system on a basic level. With blocks, you can easily depict the basic elements of the process, without drilling down. The PowerPoint presentation of major process steps and key process participants can be very informative and helpful. Using ConceptDraw DIAGRAM, you can easily convert a block diagram to an MS PowerPoint presentation.

HVAC Business Plan

Long time you have looked for the convenient and helpful software for drawing HVAC Business Plan? Now ConceptDraw DIAGRAM diagramming and vector drawing software offers you the HVAC Plans Solution from the Building Plans Area that will help you create any desired HVAC Business Plan.