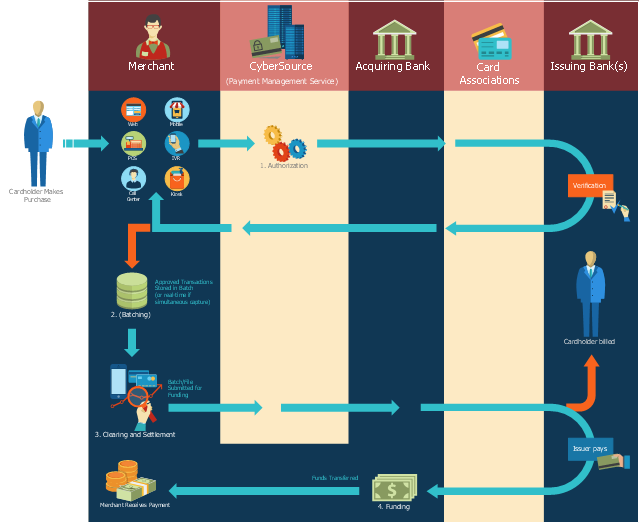
This payment process flowchart example was created on the base of the diagram of payment process using Global Payment Processing Services from the U.S. Securities and Exchange Commission website.
"Global Payment Processing Services. CyberSource Advanced enables merchants to accept payments made by all major credit and debit cards including American Express®, Discover®, Diners Club International®, JCB, MasterCard®, and Visa® cards. Our customers can also accept payment by corporate procurement cards, electronic checks, PayPal® Express Checkout, and the Bill Me Later® service. Merchants that have business models based on subscriptions can utilize the CyberSource recurring billing service with automated account updating services. For merchants selling internationally, we support direct debit, and bank transfers, as well as regional card brands such as Carte Bleue, Carta Si, Dankort, Laser, Solo, and Visa Electron. We provide these services for online, call center, kiosk, integrated voice response (“IVR”), and IP-enabled point of sale (“POS”) transactions."
[www.sec.gov/ Archives/ edgar/ data/ 934280/ 000119312510042764/ d10k.htm]
The flowchart example "Global Payment Solutions" was created using the ConceptDraw PRO diagramming and vector drawing software extended with the Sales Flowcharts solution from the Marketing area of ConceptDraw Solution Park.
Payment process flowchart
"Point of sale (also called POS or checkout) is the place where a retail transaction is completed. It is the point at which a customer makes a payment to the merchant in exchange for goods or services. At the point of sale the retailer would calculate the amount owed by the customer and provide options for the customer to make payment. The merchant will also normally issue a receipt for the transaction. ...
The modern point of sale is often referred to as the point of service because it is not just a point of sale but also a point of return or customer order. Additionally it includes advanced features to cater to different functionality, such as inventory management, CRM, financials, warehousing, etc., all built into the POS software. Prior to the modern POS, all of these functions were done independently and required the manual re-keying of information, which can lead to entry errors." [Point of sale. Wikipedia]
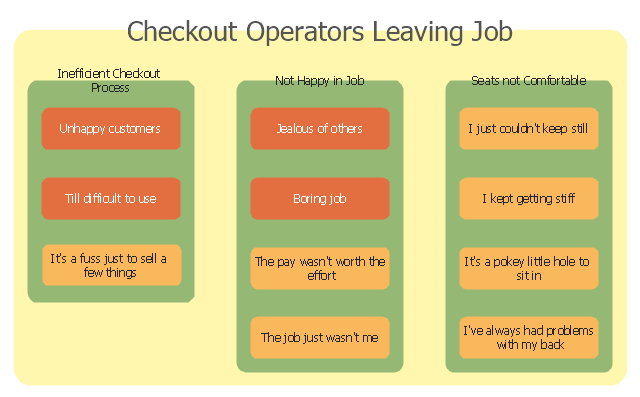
The affinity diagram example "Checkout operators leaving job" was created using the ConceptDraw PRO diagramming and vector drawing software extended with the solution "Seven Management and Planning Tools" from the Management area of ConceptDraw Solution Park.
The modern point of sale is often referred to as the point of service because it is not just a point of sale but also a point of return or customer order. Additionally it includes advanced features to cater to different functionality, such as inventory management, CRM, financials, warehousing, etc., all built into the POS software. Prior to the modern POS, all of these functions were done independently and required the manual re-keying of information, which can lead to entry errors." [Point of sale. Wikipedia]
The affinity diagram example "Checkout operators leaving job" was created using the ConceptDraw PRO diagramming and vector drawing software extended with the solution "Seven Management and Planning Tools" from the Management area of ConceptDraw Solution Park.
Affinity diagram
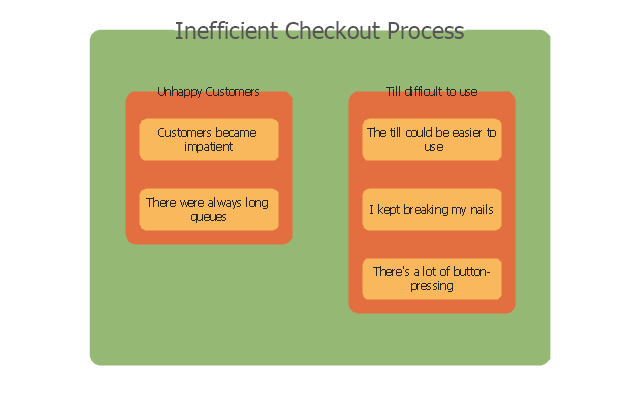
Inefficient checkout process
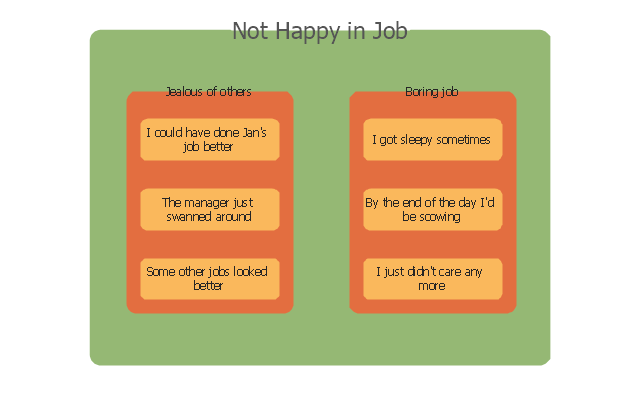
Not happy in job
Basic of Flowchart: Meaning and Symbols


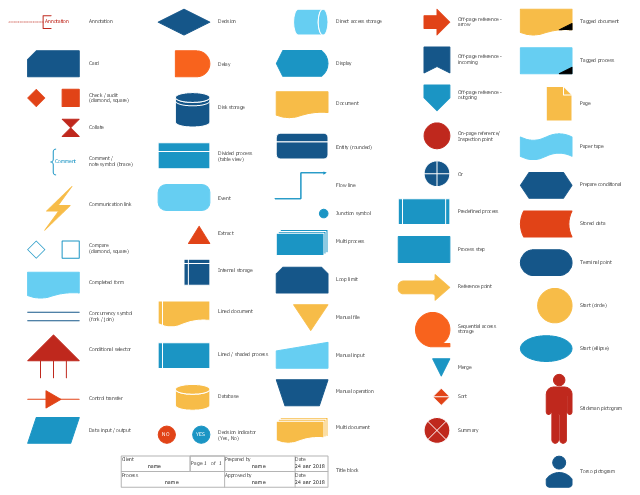
The vector stencils library "Sales flowchart" contains 62 sales process flow chart symbols.
Use these flow chart icon set to draw your sales flowcharts, workflow diagrams and process charts with the ConceptDraw PRO diagramming and vector drawing software.
The sales process flowchart symbols library "Sales flowchart" is included in the Sales Flowcharts solution from the Marketing area of ConceptDraw Solution Park.
Annotation

Card

Check / audit (diamond)
-sales-flowchart---vector-stencils-library.png--diagram-flowchart-example.png)
Check / audit (square)
-sales-flowchart---vector-stencils-library.png--diagram-flowchart-example.png)
Collate

Comment / note symbol (brace)
-sales-flowchart---vector-stencils-library.png--diagram-flowchart-example.png)
Communication link

Compare (diamond)
-sales-flowchart---vector-stencils-library.png--diagram-flowchart-example.png)
Compare (square)
-sales-flowchart---vector-stencils-library.png--diagram-flowchart-example.png)
Completed form

Concurrency symbol (fork / join)
-sales-flowchart---vector-stencils-library.png--diagram-flowchart-example.png)
Conditional selector

Control transfer

Database

Data input / output

Decision

Decision indicator - No

Decision indicator - Yes

Delay

Direct access storage

Disk storage

Display

Divided process (table view)
-sales-flowchart---vector-stencils-library.png--diagram-flowchart-example.png)
Document

Entity (rounded)
-sales-flowchart---vector-stencils-library.png--diagram-flowchart-example.png)
Event

Extract

Flow line

Internal storage

Junction symbol

Lined document

Lined / shaded process

Loop limit

Manual file

Manual input

Manual operation

Merge

Multi document

Multi process

Off-page reference - arrow
Off-page reference - incoming

Off-page reference - outgoing

On-page reference/ Inspection point

Or

Page

Paper tape

Predefined process

Prepare conditional

Process step

Reference point

Sequential access storage

Sort

Start (circle)
-sales-flowchart---vector-stencils-library.png--diagram-flowchart-example.png)
Start (ellipse)
-sales-flowchart---vector-stencils-library.png--diagram-flowchart-example.png)
Stickman pictogram

Stored data

Summary

Tagged document

Tagged process

Terminal point

Title block
Torso pictogram

Planogram Software and Retail Plan Software

Flow Chart Symbols

TQM Software — Build Professional TQM Diagrams

The vector stencils library "Sales flowchart" contains 62 flow chart symbols.
Use it to design your sales flowcharts, workflow diagrams and process charts by the ConceptDraw PRO diagramming and vector drawing software.
"Flowcharts are used in designing and documenting simple processes or programs. Like other types of diagrams, they help visualize what is going on and thereby help understand a process, and perhaps also find flaws, bottlenecks, and other less-obvious features within it. There are many different types of flowcharts, and each type has its own repertoire of boxes and notational conventions. The two most common types of boxes in a flowchart are:
(1) a processing step, usually called activity, and denoted as a rectangular box,
(2) a decision, usually denoted as a diamond." [Flowchart. Wikipedia]
The shapes example "Design elements - Sales flowchart" is included in the Sales Flowcharts solution from the Marketing area of ConceptDraw Solution Park.
Flowchart symbols
Sales Process FlowchartFlowchart Examples

Basic Diagramming Flowchart Software

How To Create a Flow Chart in ConceptDraw

Sales Process Flowchart Symbols

Copying Service Process Flowchart.Flowchart Examples

Accounting Flowchart Symbols

Technical Flow Chart Example

Flowchart Design Flowchart Symbols, Shapes, Stencils and Icons


 Sales Flowcharts
The Sales Flowcharts solution lets you create and display sales process maps, sales process workflows, sales steps, the sales process, and anything else involving sales process management.
Sales Process Flowcharts

Sales Dashboard - Access Anywhere
- ConceptDraw Solution Park | Point Of Sale System Flowchart
- Global Payment Solutions | Process Diagram For A Point Of Sale
- Sales flowchart | Point Of Sale Process Flow Diagram
- Logistics Flow Charts | Point Of Sale And Inventory Management ...
- Global Payment Solutions | Example Flow Chart Of Point Of Sale
- Sales Flowcharts | Process Diagram For A Point Of Sale System
- Sales Process Management | Sales Process Flowchart Symbols ...
- ConceptDraw Arrows10 Technology - Flowchart
- Global Payment Solutions | Pos System Flowchart
- Process Flowchart | Pos System Process Flow