Blank Scatter Plot

Scatter Plot

Bubble Plot

Make a Scatter Plot

Scatter Plot Graph

Four Dimensions Bubble Plot

This scatter graphs (scattergraph. scatter chart, scatter plot, scatterplot, scatter diagram) sample show how the scatter plot with missing categories on the left,
the growth appears to be more linear with less variation. It was designed on the base of the Wikimedia Commons files: Scatter Plot with missing categories.svg [commons.wikimedia.org/ wiki/ File:Scatter_ Plot_ with_ missing_ categories.svg], and A scatter plot without missing categories.svg [commons.wikimedia.org/ wiki/ File:A_ scatter_ plot_ without_ missing_ categories.svg].
This file is available under the Creative Commons CC0 1.0 Universal Public Domain Dedication. [creativecommons.org/ publicdomain/ zero/ 1.0/ deed.en]
"In statistics, a misleading graph, also known as a distorted graph, is a graph that misrepresents data, constituting a misuse of statistics and with the result that an incorrect conclusion may be derived from it.
Graphs may be misleading through being excessively complex or poorly constructed. Even when constructed to accurately display the characteristics of their data, graphs can be subject to different interpretation. ...
Graphs created with omitted data remove information from which to base a conclusion. ...
In financial reports, negative returns or data that do not correlate a positive outlook may be excluded to create a more favorable visual impression." [Misleading graph. Wikipedia]
The chart example "Scatter plot with missing categories" was created using the ConceptDraw PRO diagramming and vector drawing software extended with the Scatter Diagrams solution from the Graphs and Charts area of ConceptDraw Solution Park.
Scatter chart

The vector stencils library "Plots and fences" contains 27 plot and fence shapes.
Use it to create your landscape design and garden plans.
"A fence is a freestanding structure designed to restrict or prevent movement across a boundary. ... fences are used more frequently to provide visual sectioning of spaces. ...
Perimeter fencing, to prevent trespassing or theft and/ or to keep children and pets from wandering away.
Decorative fencing, to enhance the appearance of a property, garden or other landscaping." [Fence. Wikipedia]
The shapes example "Design elements - Plots and fences" was created using the ConceptDraw PRO diagramming and vector drawing software extended with the Landscape & Garden solution from the Building Plans area of ConceptDraw Solution Park.
Plots and fences icons
Scatter Chart Examples

The vector stencils library "Education charts" contains 12 graphs and charts: area chart, column chart, divided bar diagram, histogram, horizontal bar graph, line graph, pie chart, ring chart, scatter plot.
Use it to create your education infogram in the ConceptDraw PRO diagramming and vector drawing software.
The vector stencils library "Education charts" is included in the Education Infographics solution from the Business Infographics area of ConceptDraw Solution Park.
Use it to create your education infogram in the ConceptDraw PRO diagramming and vector drawing software.
The vector stencils library "Education charts" is included in the Education Infographics solution from the Business Infographics area of ConceptDraw Solution Park.
Area chart - serial

Column chart

Column chart - serial

Divided bar diagram

Frequency histogram

Horizontal bar chart

Horizontal bar chart - serial

Line chart - serial

Pie chart

Ring chart

Scatter plot

Scatter plot - serial

Best Diagramming


 Scatter Diagrams
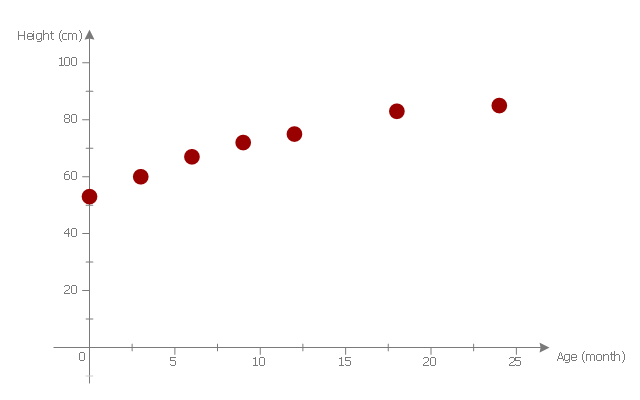
The Scatter Diagrams solution extends ConceptDraw PRO v10 functionality with templates, samples, and a library of vector stencils that make construction of a Scatter Plot easy. The Scatter Chart Solution makes it easy to design attractive Scatter Diagrams used in various fields of science, work, and life activities. ConceptDraw PRO lets you enter the data to the table and construct the Scatter Plot Graph automatically according to these data.
This scatter graph example visualize correlation between baby height and age.
"Human height is the distance from the bottom of the feet to the top of the head in a human body, standing erect. It is usually measured in centimetres when using the metric system, and feet and inches when using the imperial system. Human height has varied from under 60 centimetres (2 ft 0 in) to over 260 centimetres (8 ft 6 in). On average, males are taller than females. ...
Growth in stature, determined by its various factors, results from the lengthening of bones via cellular divisions chiefly regulated by somatotropin (human growth hormone (hGH)) secreted by the anterior pituitary gland. ...
The majority of linear growth occurs as growth of cartilage at the epiphysis (ends) of the long bones which gradually ossify to form hard bone. The legs compose approximately half of adult human height, and leg length is a somewhat sexually dimorphic trait. Some of this growth occurs after the growth spurt of the long bones has ceased or slowed. The majority of growth during growth spurts is of the long bones. Additionally, the variation in height between populations and across time is largely due to changes in leg length. The remainder of height consists of the cranium. Height is sexually dimorphic and statistically it is more or less normally distributed, but with heavy tails." [Human height. Wikipedia]
The scatter plot example "Baby height by age" was created using the ConceptDraw PRO diagramming and vector drawing software extended with the Scatter Diagrams solution from the Graphs and Charts area of ConceptDraw Solution Park.
Scatter diagram
The Best Flowchart Software Available


Scatter Graph

- Blank Scatter Plot | Scatter Chart Examples | Four Dimensions ...
- Scatter Chart Examples | Bubble Plot | Four Dimensions Bubble Plot ...
- Baby Age And Height Scatter Plot
- Blank Scatter Plot Graph
- Basic Diagramming | Line Graph | Bar Graph | Scatter Plot On Us ...
- Design elements - Plots and fences | How to Draw a Landscape ...
- Design elements - Plots and fences | Best Diagramming | Blank ...
- Scatter Diagrams | Scatter Chart Examples | Blank Scatter Plot ...
- Blank Scatter Plot | Bar Graph | The Best Drawing Program for Mac ...
- Blank Scatter Plot | How to Draw a Pictorial Chart in ConceptDraw ...
- Bubble Plot | Matrices | Marketing Area | Sample Scatter Graph For ...
- Scatter Graph Charting Software | Scatter Plot Graph | Scatter Chart ...
- Bubble Plot | Four Dimensions Bubble Plot | How To Create a ...
- Scatter Chart Examples | Scatter Plot Graph | Scatter Graph Charting ...
- Bubble Plot | Blank Scatter Plot | Scatter Chart Examples | Diagram ...
- Scatter Plot | Blank Scatter Plot | Design elements - Scatterplot ...
- Scatter Plots
- Scatter Chart Examples | Scatter Graph Charting Software | Blank ...
- Best Diagramming | Blank Scatter Plot | Four Dimensions Bubble ...
- Scatter Chart Examples | Scatter Diagram | Blank Scatter Plot ...