
Pic. 1. Bubble Plot
Using the Bubble Diagrams Solution for ConceptDraw DIAGRAM you can create your own professional Bubble Diagrams quick and easy.
The Bubble Diagrams produced with ConceptDraw DIAGRAM are vector graphic documents and are available for reviewing, modifying, and converting to a variety of formats (image, HTML, PDF file, MS PowerPoint Presentation, Adobe Flash or MS Visio).
Download Full Software Package and View Examples for Free
More Related Diagrams:
TEN RELATED HOW TO's:
Download ConceptDraw diagram software for easy drawing.
Picture: The Best Choice for Creating Diagram
Related Solution:
Nature solution expands ConceptDraw DIAGRAM software with samples, templates and libraries of vector clip art for drawing of Nature illustrations.
Use Geography library of vector stencils to draw natural landscapes.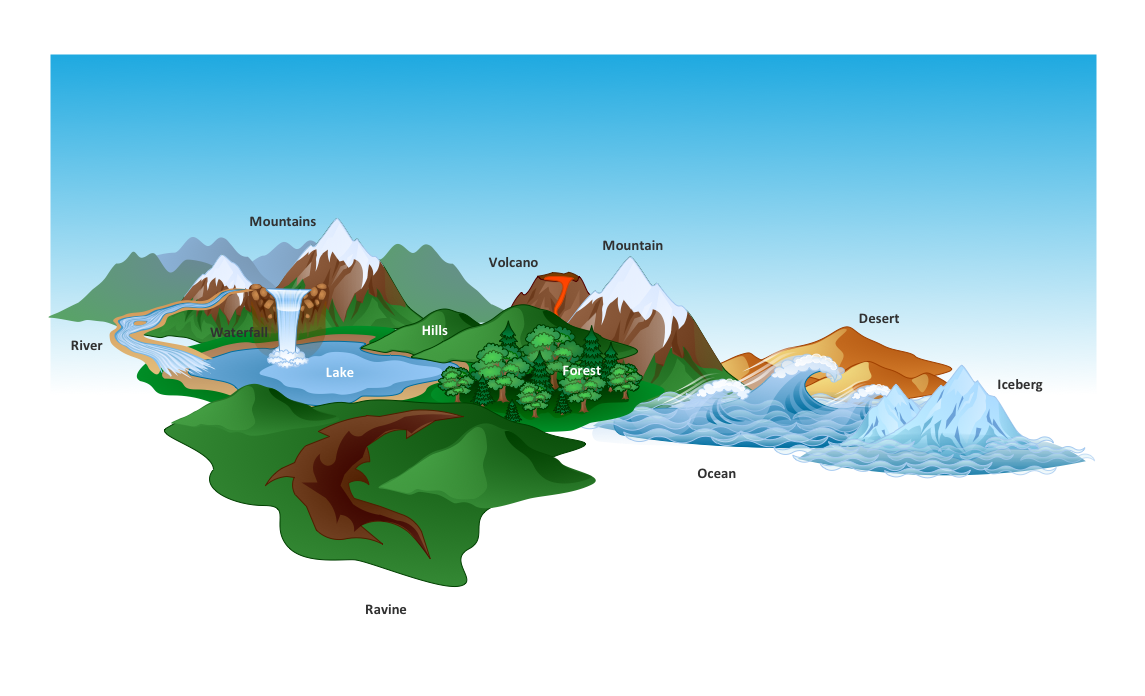
Picture: How to Draw a Natural Landscape
Pipe Bender Plans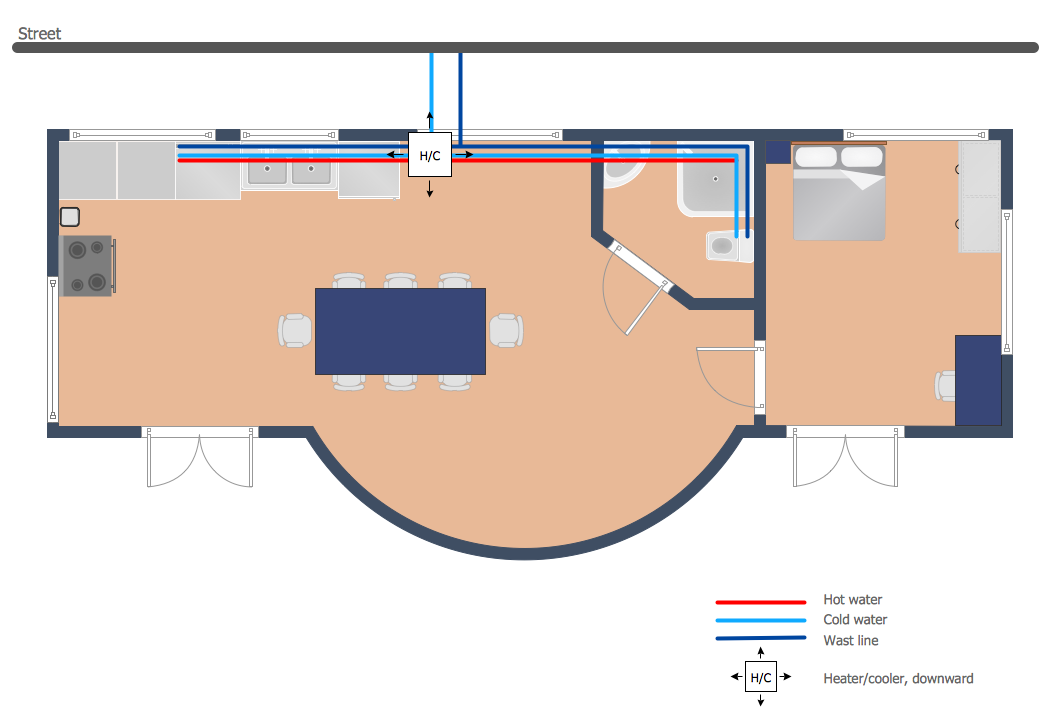
Picture: Pipe Bender Plans
Related Solution:
ConceptDraw DIAGRAM diagramming and vector drawing software offers the Scatter Diagrams Solution from the Graphs and Charts Area to make a Scatter Plot creating fast and simple.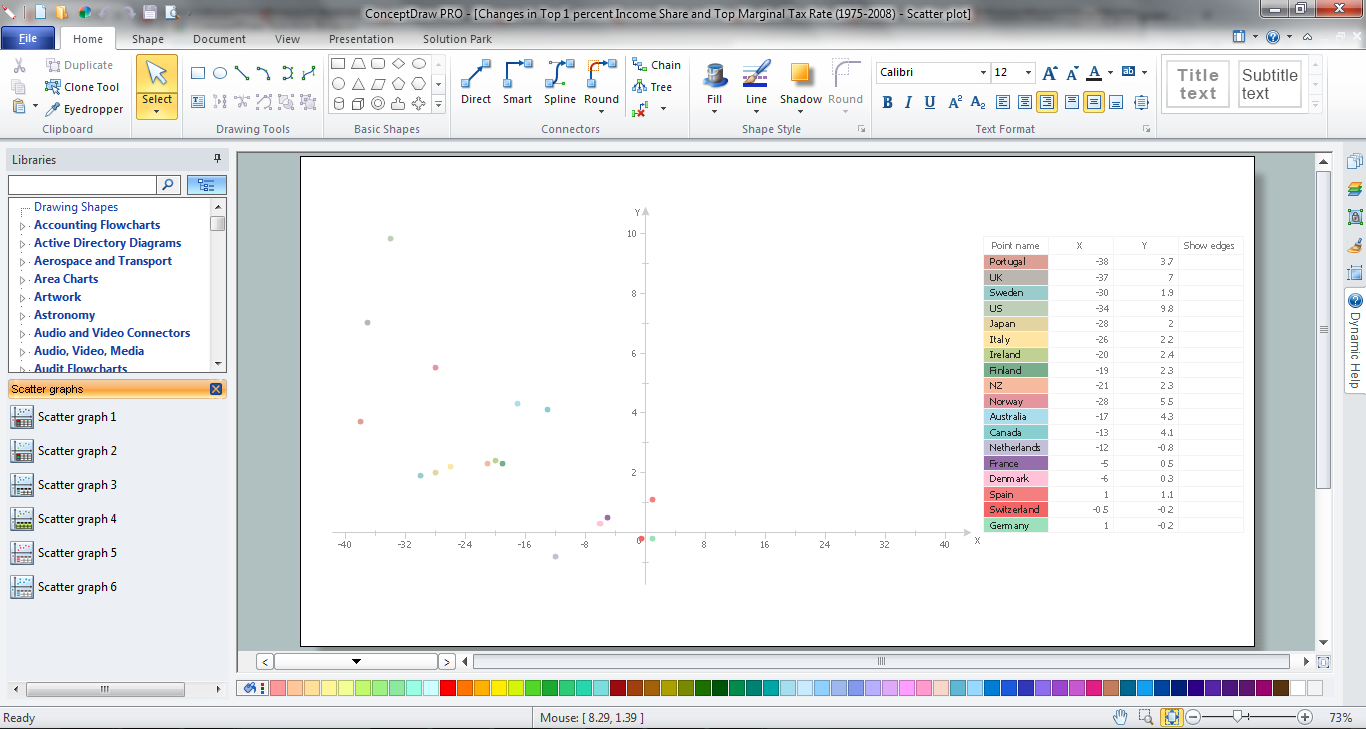
Picture: Make a Scatter Plot
Related Solution:
ConceptDraw DIAGRAM creates drawings, diagrams and charts with great visual appeal in MacOS
Picture: Percentage Spider Chart
Related Solution:
In case you need to make a plan for your own future hotel or to do it for someone else, then you can always find the way to make such template very quickly and to have a very good looking result in the end. Whichever type of the hotels you want to illustrate in a way of a floor plan, you can always do it with ConceptDraw DIAGRAM drawing application.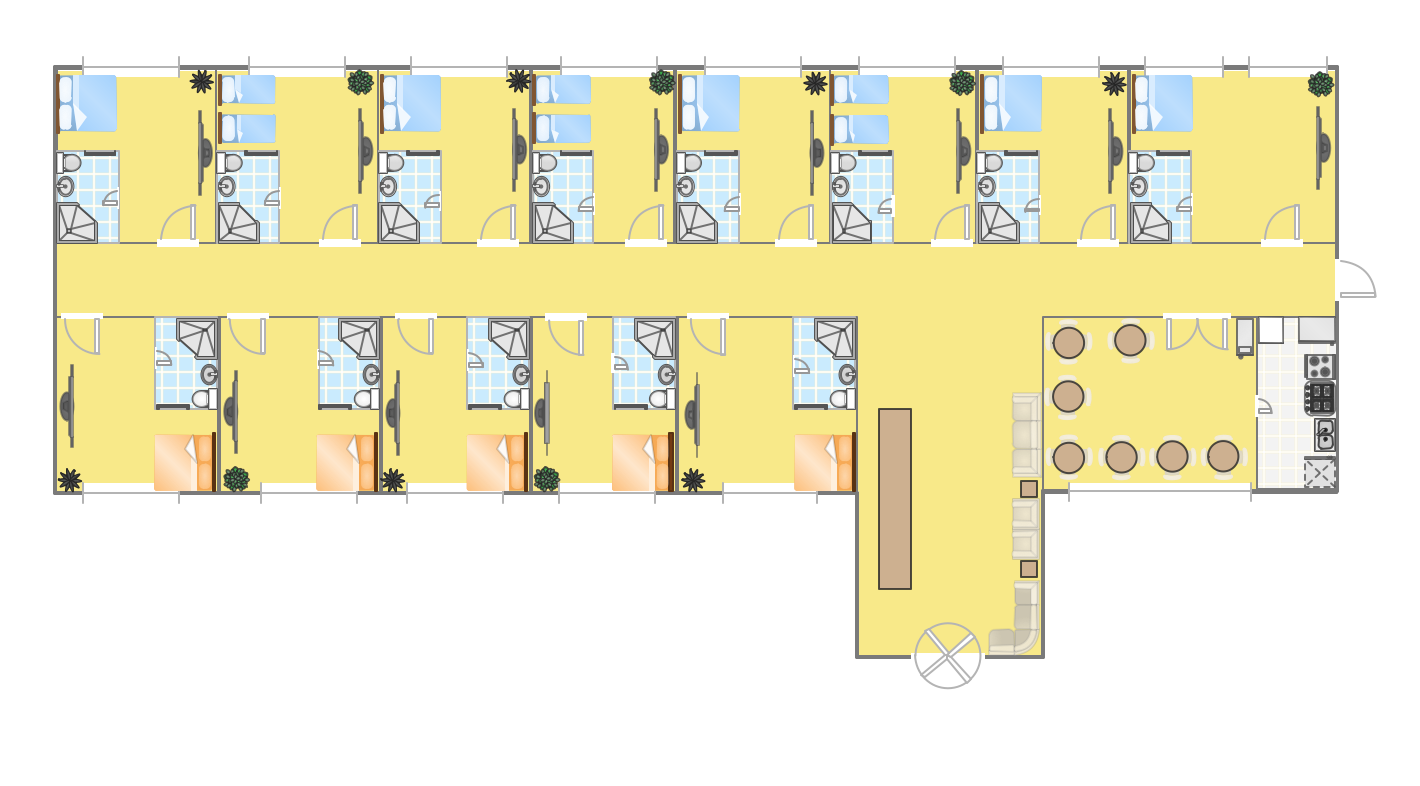
Picture: Hotel Plan. Hotel Plan Examples
Related Solution:
When moving to a new apartment it is always pleasure to develop an interior design project. Nevertheless, another important part that should not be forgotten is the piping plan, because wrong piping system might ruin all the renovation. So, to avoid such problems, a stress analysis is performed.
Plumbing and piping plans should be created for any premises. They are used to trace location of pipes, fixtures and valves in the house. This diagram presents a set of certified piping plan symbols for drawing plumbing and piping floor plans, diagrams and other technical drawings. Applying standard symbols when creating a piping plan is very important for creating a valid piping plan included into the building documentation pack. It is essential for any professional to be able to read and properly interpreted any piping plan.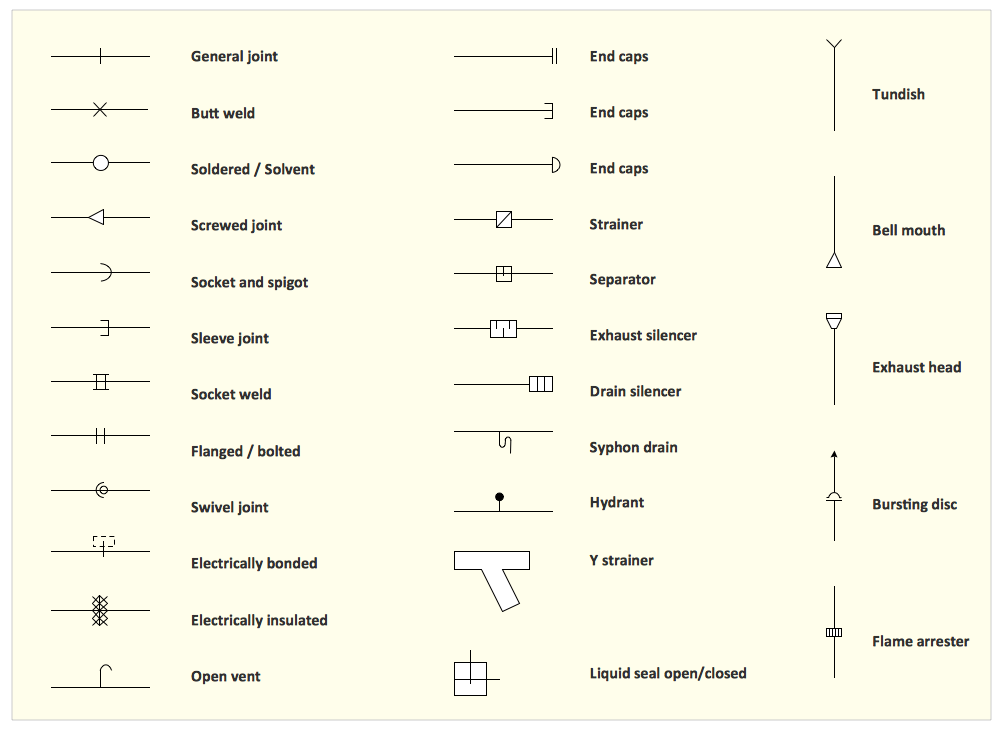
Picture: Interior Design. Piping Plan — Design Elements
Related Solution:
ConceptDraw DIAGRAM is a powerful diagramming and vector drawing software. Extended with Language Learning solution from the Science and Education area of ConceptDraw Solution Park it become also effective sentence diagrammer software.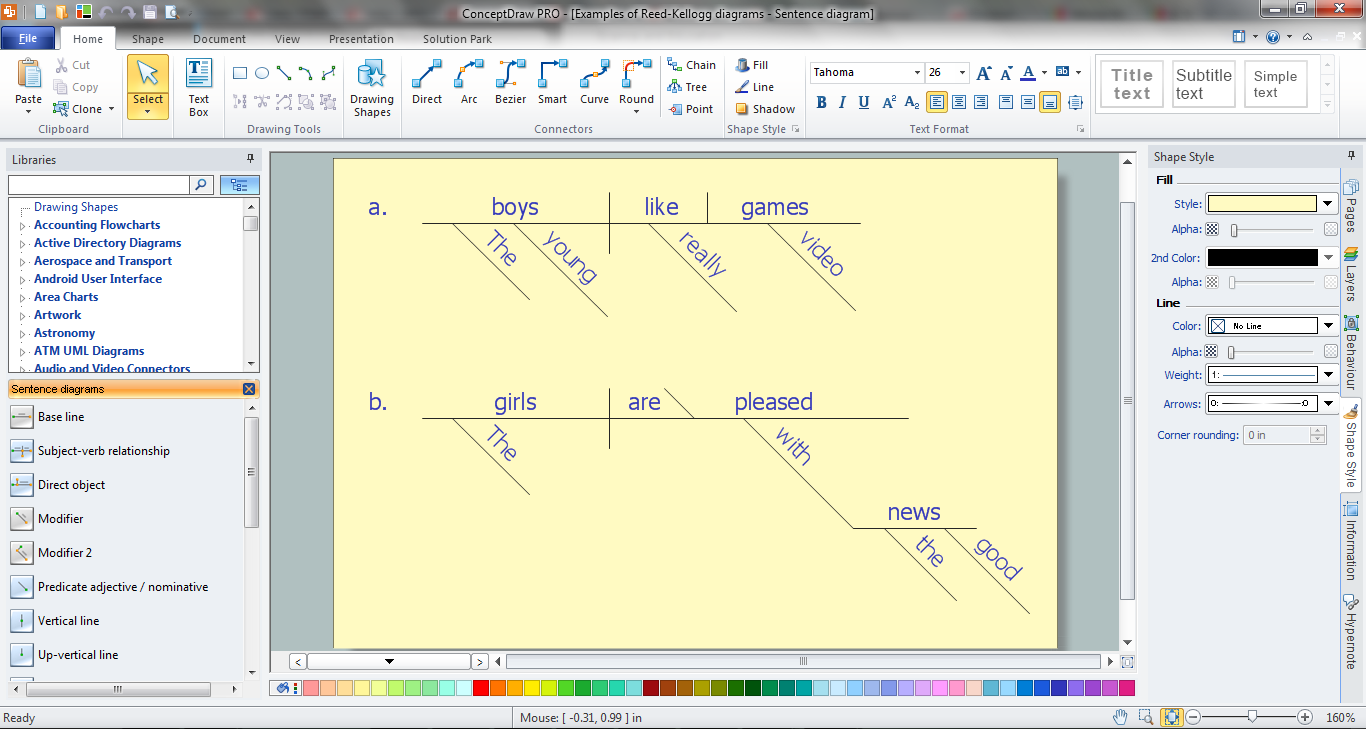
Picture: Sentence Diagrammer
Related Solution:
Those triangles within any technical analysis are known to be the chart patterns that can be commonly found in the price charts of the financially traded assets, such as stocks, futures, bonds, etc. The pattern is known to be deriving its name from the fact that it is characterized by some contraction in a price range being the converged trend lines, giving it a triangular shape.
Picture: Pyramid Diagram
Related Solution:
ConceptDraw DIAGRAM is a powerful intelligent vector graphics engine that can be used to create basic diagrams including flowcharts, charts, workflows, flowcharts, organizational charts, business diagram, learn business diagrams, flow diagrams.
Picture: The Best Mac Software for Diagramming or Drawing
Related Solution: