Bubble Plot
This sample was created in ConceptDraw PRO diagramming and vector drawing software using the Bubble Diagrams Solution from the ConceptDraw Solution Park. This sample shows the BCG (Boston Consulting Group) matrix that is used in marketing and product management for strategic analysis and planning.Four Dimensions Bubble Plot
This sample was created in ConceptDraw PRO diagramming and vector drawing software using the Bubble Diagrams Solution from the "What is a Diagram" area of ConceptDraw Solution Park. This sample clearly shows the Four Dimensions Bubble Diagram of the distribution of chlorine contaminant in the water source. This Bubble Diagram is very useful in the chemistry, hydrology, and ecology.How To Create a Bubble Chart
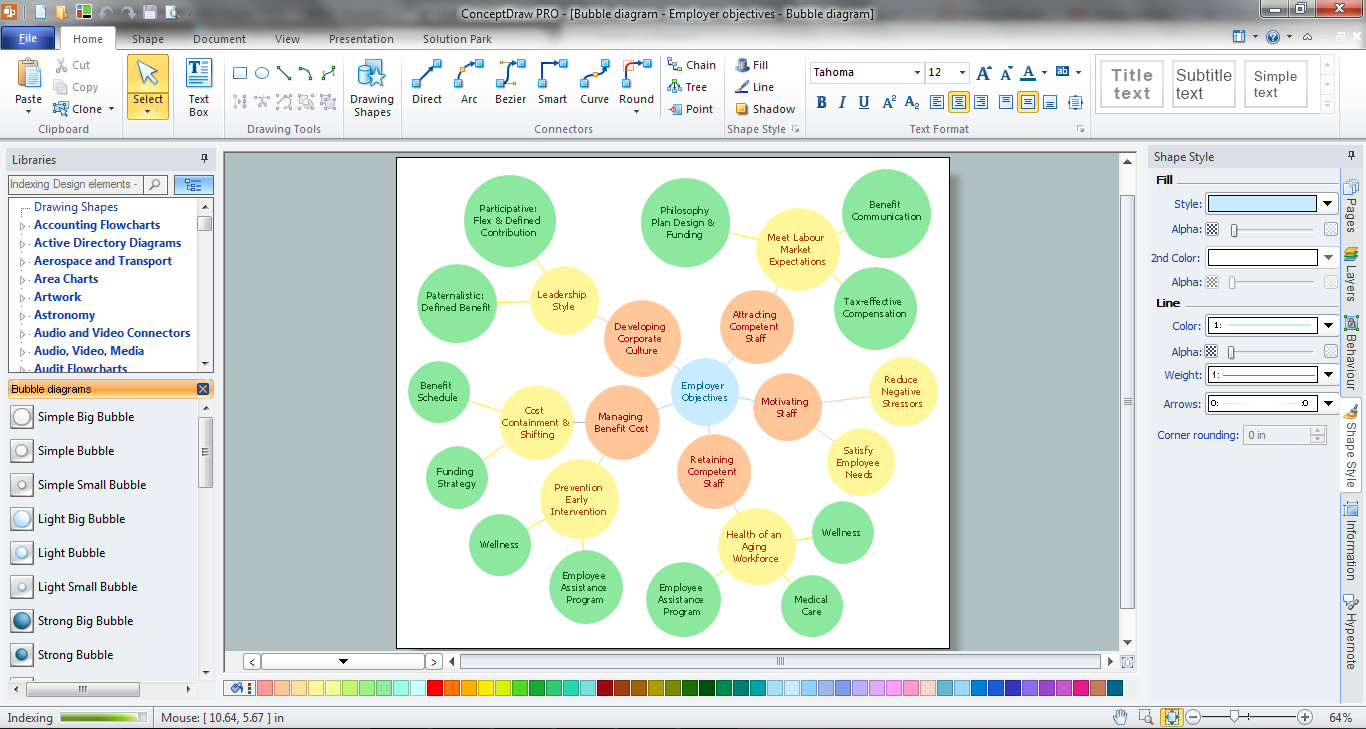
Bubble diagrams solution extends ConceptDraw PRO software with templates, Using ConceptDraw Connectors, you can create a bubble chart in moments. Using ConceptDraw you will be able to create a bubble chart from the ready ConceptDraw library objects or make your own objects. The created diagram can represent ideas organization, in brainstorming processes, by teachers for explaining difficult ideas or for presentations.How To Make a Bubble Chart
Bubble diagrams solution extends ConceptDraw PRO software with templates, Using ConceptDraw Connectors, you can make a bubble chart in moments. Using ConceptDraw you will be able to make a bubble chart from the ready ConceptDraw library objects or make your own objects. The created diagram can represent ideas organization, in brainstorming processes, by teachers for explaining difficult ideas or for presentations.Bubble Chart
How to design a Bubble Chart? It’s very easy! All that you need is a powerful software. Never before creation of a Bubble Chart wasn’t so easy as now with tools of Bubble Diagrams Solution from the "What is a Diagram" Area for ConceptDraw Solution Park.Bubble Chart Maker
ConceptDraw PRO diagramming and vector drawing software extended with Bubble Diagrams Solution from the "What is a Diagram" Area is a powerful Bubble Chart Maker.Flow Chart Creator
ConceptDraw PRO is a flowchart design software. There are large collections of professional flowchart symbols for process flow diagrams, standard flowchart symbols and colored basic flowchart symbols. Built-in examples and video lessons allow users to get started immediately and do drawing of virtually any type of flowchart or process flow diagramsBeauty in nature Illustrations and Clipart
Nature solution expands our software possibilities to create beautiful illustrations and cliparts with the new library which contains 17 vector objects.Best Diagramming
Need to draw a diagram, process chart, flowchart, organizational chart, graphic design? ConceptDraw can help you to make professional graphic documents quickly.
The Best Flowchart Software Available
ConceptDraw gives the ability to draw Flowchart documents. Flowcharts solutionis a powerful tool that extends ConceptDraw application for drawing business flowcharts. ConceptDraw PRO vector diagramming and business graphics software enhanced with with templates, green and interactive flowchart makers, samples and stencil libraries from ConceptDraw Solution Park which all focused to help with drawing flowcharts, block diagrams, bar charts, histograms, pie charts, divided bar diagrams, line graphs, area charts, scatter plots, circular arrows diagrams, Venn diagrams, bubble diagrams, concept maps, and others.
Bar Diagrams for Problem Solving. Create space science bar charts with Bar Graphs Solution
Bar charts represent data in different categories or groups. Create bar graphs for visual solving your scientific problems and data comparison using the ConceptDraw PRO diagramming and vector drawing software extended with the Bar Graphs Solution from the Graphs and Charts area of ConceptDraw Solition Park.Donut Chart Templates
These donut chart templates was designed using ConceptDraw PRO diagramming and vector drawing software extended with Pie Charts solution from Graphs and Charts area of ConceptDraw Solution Park. All these donut chart templates are included in the Pie Charts solution. You can quickly rework these examples into your own charts by simply changing displayed data, title and legend texts.Bubble diagrams with ConceptDraw PRO
Using ConceptDraw you will be able to create bubble diagrams from the ready ConceptDraw library objects or make your own objects. The created diagram can be saved and edited, objects can be moved and links between them will be automatically repainted after object moving because of using the ConceptDraw connectors.Best Diagramming Software for Mac
ConceptDraw PRO creates drawings, flowcharts, block diagrams, bar charts, histograms, pie charts, divided bar diagrams, line graphs, area charts, scatter plots, circular arrows diagrams, Venn diagrams, bubble diagrams with great visual appeal on Mac OS X.
 Bubble Diagrams
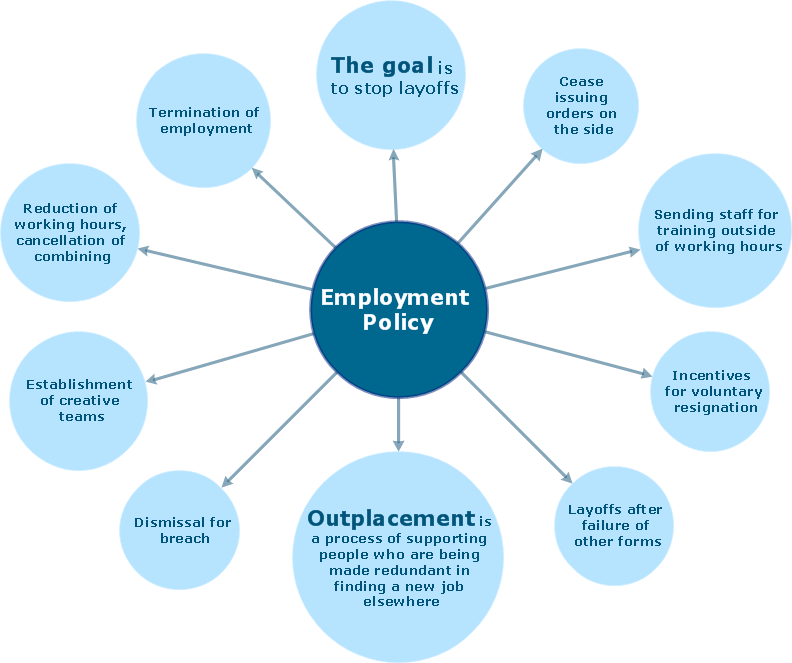
Bubble diagrams have enjoyed great success in software engineering, architecture, economics, medicine, landscape design, scientific and educational process, for ideas organization during brainstorming, for making business illustrations, presentations, planning, design, and strategy development. They are popular because of their simplicity and their powerful visual communication attributes.
- Bubble Plot Templates And Example
- Bubble Plot | Spider Chart Template | Blank Scatter Plot | Plot ...
- How To Create a Bubble Chart | Four Dimensions Bubble Plot ...
- Bubble Plot | Matrices | Competitor Analysis | Sample Scatter Graph ...
- ConceptDraw Solution Park | Bubble Plot | Marketing Diagrams ...
- Bubble Plot | Matrices | Marketing Area | Boston Matrix Bubble ...
- Four Dimensions Bubble Plot | Nature | Flowchart Programing ...
- Best Diagramming | Blank Scatter Plot | Four Dimensions Bubble ...
- Four Dimensions Bubble Plot | Hydrology Drawing
- How to Draw a Bubble Chart
- Four Dimensions Bubble Plot | Nature | Flow Chart Diagram In ...
- How To Create a Bubble Chart | Bubble diagrams in Landscape ...
- Bubble Chart | Technical Flow Chart Example | How To Create a ...
- Scatter Plot | Cafe electrical floor plan | Four Dimensions Bubble Plot ...
- Four Dimensions Bubble Plot | Nature | Hydrological Dystem Drawing
- Bubble Chart Example
- Best Diagramming Software for Mac | How To Create a Bubble Chart ...
- Four Dimensions Bubble Plot | Chart Maker for Presentations ...
- Beauty in nature Illustrations and Clipart | Four Dimensions Bubble ...


