 Picture Graphs
Typically, a Picture Graph has very broad usage. They many times used successfully in marketing, management, and manufacturing. The Picture Graphs Solution extends the capabilities of ConceptDraw PRO v10 with templates, samples, and a library of professionally developed vector stencils for designing Picture Graphs.
This pictorial bar chart sample was redesigned from the Wikimedia Commons file: Barrie Population.jpg.
[commons.wikimedia.org/ wiki/ File:Barrie_ Population.jpg]
"Barrie is a city in Central Ontario, Canada, on the western shore of Lake Simcoe. Although located in Simcoe County, the city is politically independent. Barrie is within the northern part of the Greater Golden Horseshoe, a densely populated and industrialized region of Ontario.
In 2011 census, the city's population was originally reported as 135,711, making it the 34th largest in Canada. The city's 2011 population was subsequently revised to 136,063. The Barrie census metropolitan area (CMA) had a population of 187,013 residents, making it the 21st largest CMA in Canada." [Barrie. Wikipedia]
The picture bar graph example "Barrie population" was created using the ConceptDraw PRO diagramming and vector drawing software extended with the Picture Graphs solution from the Graphs and Charts area of ConceptDraw Solution Park.
Picture bar graph

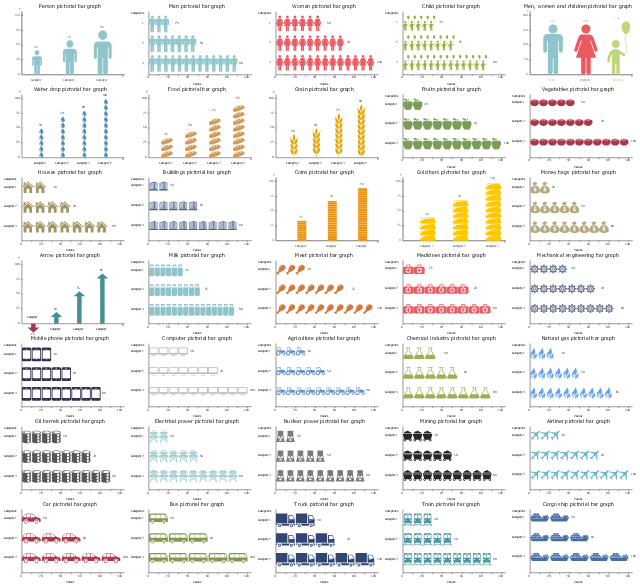
A picture chart (image chart, pictorial graph) is the type of a bar graph visualizing numarical data using symbols and pictograms.
In the field of economics and finance use a picture graph with columns in the form of coins. For population comparison statistics use a chart with columns in the form of manikins. To show data increase or decrease use arrows bar charts.
The picture graph template for the ConceptDraw PRO diagramming and vector drawing software is included in the Picture Graphs solution from the Graphs and Charts area of ConceptDraw Solution Park.
Arrows bar graph template
The vector stencils library "Picture Graphs" contains templates of picture bar graphs for visual data comparison. Use these shapes to draw your pictorial bar charts in the ConceptDraw PRO diagramming and vector drawing software extended with the Picture Graphs solution from the Graphs and Charts area of ConceptDraw Solution Park.
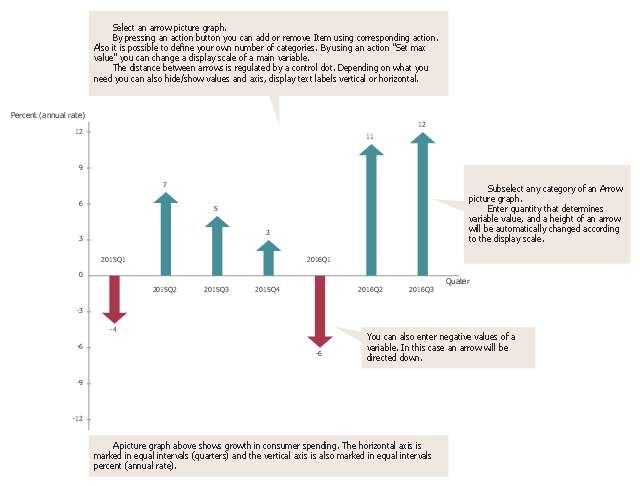
Arrow picture graph (control dots)
Arrow picture graph (text -> height)
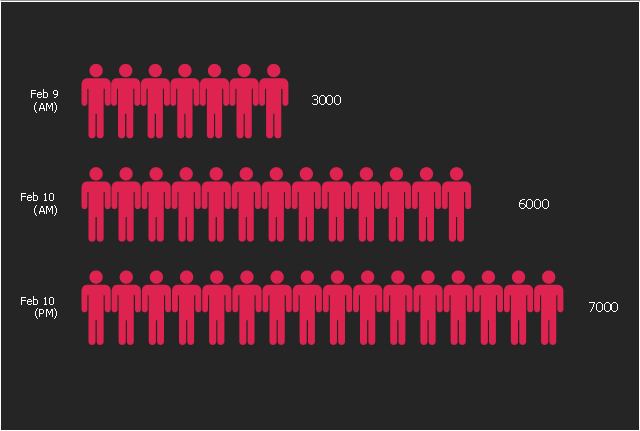
Picture graph (person)
-picture-graphs---vector-stencils-library.png--diagram-flowchart-example.png)
Picture graph (coins)
-picture-graphs---vector-stencils-library.png--diagram-flowchart-example.png)
Sales Growth. Bar Graphs Example

"Pictorial bar graph.
Sometimes reffered to as a pictographs. A pictorial bar graph is a graph in which the rectangular bars have been filled with pictures, sketches, icons, etc. or where pictures, sketches, icons, etc. have been substituted for the rectangular bars. In both variations, one or more symbols might be used in each bar. The two major reasons for using pictorial graphs are to make the graph more appealing visually and to facilitate better communications." [Information Graphics: A Comprehensive Illustrated Reference. R. L. Harris. 1999. p.41]
The example"Design elements - Picture graphs" was created using the ConceptDraw PRO diagramming and vector drawing software extended with the Picture Graphs solution from the Graphs and Charts area of ConceptDraw Solution Park.
Pictorial chart templates
Picture Graph

 Bar Graphs
The Bar Graphs solution enhances ConceptDraw PRO v10 functionality with templates, numerous professional-looking samples, and a library of vector stencils for drawing different types of Bar Graphs, such as Simple Bar Graph, Double Bar Graph, Divided Bar Graph, Horizontal Bar Graph, Vertical Bar Graph, and Column Bar Chart.
"Anonymous (used as a mass noun) is a loosely associated international network of activist and hacktivist entities. A website nominally associated with the group describes it as "an internet gathering" with "a very loose and decentralized command structure that operates on ideas rather than directives". The group became known for a series of well-publicized publicity stunts and distributed denial-of-service (DDoS) attacks on government, religious, and corporate websites.
Anonymous originated in 2003 on the imageboard 4chan, representing the concept of many online and offline community users simultaneously existing as an anarchic, digitized global brain. Anonymous members (known as "Anons") can be distinguished in public by the wearing of stylised Guy Fawkes masks." [Anonymous (group). Wikipedia]
This pictorial bar graph sample was redesigned from the Wikimedia Commons file: A graph to show the increse in subscibers on YouTube to Anonymous' videos.jpg. [commons.wikimedia.org/ wiki/ File:A_ graph_ to_ show_ the_ increse_ in_ subscibers_ on_ YouTube_ to_ Anonymous%27_ videos.jpg]
This file is licensed under the Creative Commons Attribution 3.0 Unported license. [creativecommons.org/ licenses/ by/ 3.0/ deed.en]
The picture chart example "The increse in subscibers on YouTube to Anonymous' videos" was created using the ConceptDraw PRO diagramming and vector drawing software extended with the Picture Graphs solution from the Graphs and Charts area of ConceptDraw Solution Park.
Picture bar graph
This arrows bar chart example was drawn on the base of the infographics "Inside America's Economic Machine" from the website of the United States Census Bureau.
[census.gov/ how/ img/ Econ_ Infographic.jpg]
"The Advance Report on Durable Goods Manufacturer's Shipments, Inventories and Orders, or the Durable Goods Report, provides data on new orders received from more than 4,000 manufacturers of durable goods, which are generally defined as higher-priced capital goods orders with a useful life of three years or more, such as cars, semiconductor equipment and turbines.More than 85 industries are represented in the sample, which covers the entire United States." [Economic Indicators: Durable Goods Report. R. Barnes. investopedia.com/ university/ releases/ durablegoods.asp]
The arrow graph example "Total value of manufacturers' shipments" was created using the ConceptDraw PRO diagramming and vector drawing software extended with the Picture Graphs solution from the Graphs and Charts area of ConceptDraw Solution Park.
Arrows bar chart
 ConceptDraw Solution Park
ConceptDraw Solution Park collects graphic extensions, examples and learning materials
Chart Software for Better Presentations

Graphs and Charts Area provide a wide collection of professional looking predesigned templates, samples and ready-to-use vector stencils that will help you to draw the charts and diagrams of various types: Pie Charts, Donut Charts, Line Charts, Column Charts, Bar Charts, Pyramids, Scatter Charts, Venn Diagrams, Spider Charts, Area Charts, Divided Bar Graphs.
What Is a Picture Graph?

Pictures of Graphs

Bar Graph

 Divided Bar Diagrams
The Divided Bar Diagrams Solution extends the capabilities of ConceptDraw PRO v10 with templates, samples, and a library of vector stencils for drawing high impact and professional Divided Bar Diagrams and Graphs, Bar Diagram Math, and Stacked Graph.
Bar Chart Template for Word

You can quickly rework these bar graph templates into your own charts by simply changing displayed data, title and legend texts.
This double bar chart example was drawn on the base of picture "Nitrate Concentration (milligrams per liter; mg/ L) in Community Water Systems (CWS), Mean and Maximum by Year, New Mexico 1999-2012" from the New Mexico's Indicator-Based Information System (NM-IBIS) website.
"Nitrate toxicity is a preventable cause of methemoglobinemia (blue baby syndrome), especially in infants. Infants younger than 4 months of age are at greatest risk of toxicity from nitrate-contaminated drinking water.
These infants are more susceptible to developing methemoglobinemia because the pH of their gut is normally higher (less acidic) than in older children and adults. The higher pH enhances the conversion of ingested nitrate to the more toxic nitrite. The bacterial flora of a young infant's gut is also different from that found in older children and adults and might be more likely to convert ingested nitrate to nitrite. Gastroenteritis can increase body transformation of nitrate to nitrite and absorption into the bloodstream of nitrite from the large intestine.
A large proportion of hemoglobin in young infants is in the form of fetal hemoglobin. Fetal hemoglobin is more readily oxidized to methemoglobin (MHg) by nitrites than is adult hemoglobin. In addition, in infants, the enzyme (NADH-dependent methemoglobin reductase) responsible for reduction of formed MHg back to normal hemoglobin has only about half the activity it has in adults.
Symptoms such as shortness of breath and bluish skin coloring around the mouth, hands, or feet, can occur in infants rapidly over a period of days. If the condition is severe, it could lead to convulsions, coma, and even death, if untreated. Most older children and adults can take in larger amounts of nitrate without experiencing the same health effects as infants. However, pregnant women, nursing mothers, and people with low stomach acid conditions or those deficient in an enzyme that changes MHg back to normal hemoglobin are more susceptible to nitrate-induced methemoglobinemia and could be affected by water with nitrate levels above 10 mg/ L.
Adverse reproductive outcomes such as spontaneous abortions, intrauterine growth retardation, and various birth defects such as anencephaly have been reported in scientific literature from exposure to high nitrate levels in drinking water; however, the evidence is inconsistent.
Little is known about possible health effects from high nitrate level exposure over a long period of time. However, some studies suggest that there might be a risk of stomach, esophageal or bladder cancers in people with prolonged ingestion of high levels of nitrate. This might be due to the formation of nitrosoamines in the body following ingestion exposure to high levels of nitrate.
International Agency for Research on Cancer (IARC) classified ingested nitrate or nitrite as probably carcinogenic to humans (Group 2A) under conditions that result in formation of nitroso-compounds (e.g., nitrosoamines) in the body (endogenous nitrosation)." [ibis.health.state.nm.us/ indicator/ view/ CommWaterNitrates.MeanMax.Year.html]
The double bar graph example "Nitrate concentration in Community Water Systems (CWS)" was created using the ConceptDraw PRO diagramming and vector drawing software extended with the Bar Graphs solution from the Graphs and Charts area of ConceptDraw Solution Park.
Double bar graph
---double-bar-chart.png--diagram-flowchart-example.png)
Bar Chart

 Line Graphs
How to draw a Line Graph with ease? The Line Graphs solution extends the capabilities of ConceptDraw PRO v10 with professionally designed templates, samples, and a library of vector stencils for drawing perfect Line Graphs.
- Picture Graphs | Line Graphs | Bar Graphs | Graphs
- Picture Graphs | Design elements - Picture graphs | How to Create a ...
- Bar Graphs | Picture Graphs | Divided Bar Diagrams | Bar Graphs On ...
- Double Bar Graph | Chart Maker for Presentations | Picture Graphs ...
- Picture graph template | Area Charts | Basic Diagramming | Bar ...
- Graphs and Charts Area | Bar Graphs | Picture Graphs | Charts Graphs
- Barrie population - Picture bar graph
- Sales Growth. Bar Graphs Example | Bar Graphs | Sales Dashboard ...
- Picture graph
- Design elements - Picture graphs | Picture graphs - Vector stencils ...
- Picture graph template | Business and Finance Illustrations ...
- Picture graph template | Picture Graphs | Bar Chart Software ...
- Basic Diagramming | Picture Graphs | Create Graphs and Charts ...
- Double Bar Graph | Create Graphs and Charts | Design elements ...
- Picture graph template | Basic Diagramming | The Best Drawing ...
- Picture graph template | Design elements - Picture graphs | Graphs ...
- Bar Graphs | Bar Diagrams for Problem Solving. Create event ...
- Picture graph template | Picture graphs - Vector stencils library ...
- Picture graph - Template
- Picture Graphs | Picture graph - Population growth by continent ...