Venn Diagram Template for Word

Venn Diagram

Total Quality Management Definition

Landscape Plan

How To use Landscape Design Software

Control and Information Architecture Diagrams (CIAD) with ConceptDraw PRO

Multi Layer Venn Diagram. Venn Diagram Example

Organizational Structure Total Quality Management

HelpDesk
How to Create a Venn Diagram in ConceptDraw PRO

This marketing diagram sample illustrates leaky bucket model.
"The leaky bucket theory. The leaky bucket theory is the model that seeks to describe the process of customer gain and loss, otherwise known as customer churn. Customer retention is one of the key concepts in relationship marketing. Most companies concentrate on recruiting new customers to replace customers who move on, rather than seeking to retain customers." [Blythe J. Key Concepts in Marketing. 2009. knowledge.sagepub.com/ view/ key-concepts-in-marketing/ n5.xml]
"Customer attrition, also known as customer churn, customer turnover, or customer defection, is the loss of clients or customers.
Banks, telephone service companies, Internet service providers, pay TV companies, insurance firms, and alarm monitoring services, often use customer attrition analysis and customer attrition rates as one of their key business metrics (along with cash flow, EBITDA, etc.) because the "...cost of retaining an existing customer is far less than acquiring a new one." Companies from these sectors often have customer service branches which attempt to win back defecting clients, because recovered long-term customers can be worth much more to a company than newly recruited clients." [Customer attrition. Wikipedia]
The chart example "Leaky bucket diagram" was created using the ConceptDraw PRO diagramming and vector drawing software extended with the Marketing Diagrams solution from the Marketing area of ConceptDraw Solution Park.
Marketing chart

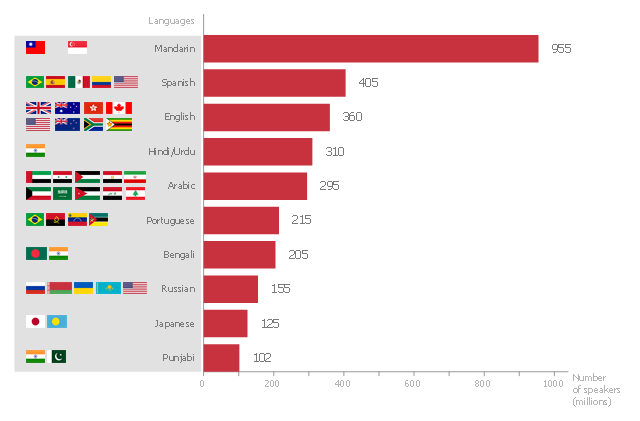
This bar graph sample shows the number of speakers for the most spoken languages of the world.
"In the philosophy of language, a natural language (or ordinary language) is any language which arises in an unpremeditated fashion as the result of the innate facility for language possessed by the human intellect. A natural language is typically used for communication, and may be spoken, signed, or written. Natural language is distinguished from constructed languages and formal languages such as computer-programming languages or the "languages" used in the study of formal logic, especially mathematical logic. ... Though the exact definition varies between scholars, natural language can broadly be defined in contrast on the one hand to artificial or constructed languages, computer programming languages like Python and international auxiliary languages like Esperanto, and on the other hand to other communication systems in nature, such as the waggle dance of bees. Although there are a variety of natural languages, any cognitively normal human infant is able to learn any natural language. By comparing the different natural languages, scholars hope to learn something about the nature of human intelligence and the innate biases and constraints that shape natural language, which are sometimes called universal grammar. The term "natural language" refers only a language that has developed naturally, and hence to actual speech, rather than prescribed speech. Hence, unstandardized speech (such as African American Vernacular English) is natural, whereas standardized speech such as Standard American English, which is in part prescribed, is somewhat artificial." [Natural language. Wikipedia]
The horizontal bar chart example "The most spoken languages of the world" was created using the ConceptDraw PRO diagramming and vector drawing software extended with the Bar Graphs solution from the Graphs and Charts area of ConceptDraw Solution Park.
Horizontal bar graph
Building Drawing Software for Design Office Layout Plan


Restaurant Floor Plan Software

Emergency Plan

- Pond Stones Vector
- Flowers Vector Plan
- Geography - Vector stencils library | ConceptDraw Solution Park ...
- How To use Landscape Design Software | Plant Layout Plans ...
- Design elements - Garden furniture | Landscape Design Software ...
- Basketball Court Dimensions | Venn Diagram Template | Cylinder ...
- Buildings and green spaces - Vector stencils library | Chemistry ...
- Horizontal bar chart - The most spoken languages of the world ...
- Cabinets and bookcases - Vector stencils library | Design elements ...
- Garden Architecture Vector
- Vectors Of Plants For Garden Plans
- Business People Clipart | Tables - Vector stencils library | Seating ...
- Design elements - Garden furniture | How To use Landscape Design ...
- How To use Landscape Design Software
- Design elements - Bushes and trees (trees) | How To use ...
- Landscaping Gardening Plan Vector Free
- Vector Pond Square
- How To use Landscape Design Software | How To Create ...
- How to Draw a Landscape Design Plan | How To use Landscape ...
- Office furniture - Vector stencils library | Seating Plans | Cafe and ...