"Project planning is part of project management, which relates to the use of schedules such as Gantt charts to plan and subsequently report progress within the project environment.
Initially, the project scope is defined and the appropriate methods for completing the project are determined. Following this step, the durations for the various tasks necessary to complete the work are listed and grouped into a work breakdown structure. Project planning is often used to organize different areas of a project, including project plans, work loads and the management of teams and individuals. The logical dependencies between tasks are defined using an activity network diagram that enables identification of the critical path. Float or slack time in the schedule can be calculated using project management software. Then the necessary resources can be estimated and costs for each activity can be allocated to each resource, giving the total project cost. At this stage, the project schedule may be optimized to achieve the appropriate balance between resource usage and project duration to comply with the project objectives. Once established and agreed, the project schedule becomes what is known as the baseline schedule. Progress will be measured against the baseline schedule throughout the life of the project. Analyzing progress compared to the baseline schedule is known as earned value management.
The inputs of the project planning phase include the project charter and the concept proposal. The outputs of the project planning phase include the project requirements, the project schedule, and the project management plan." [Project planning. Wikipedia]
The flow chart example "Project planning process" was created using the ConceptDraw PRO diagramming and vector drawing software extended with the Flowcharts solution from the area "What is a Diagram" of ConceptDraw Solution Park.
HelpDesk
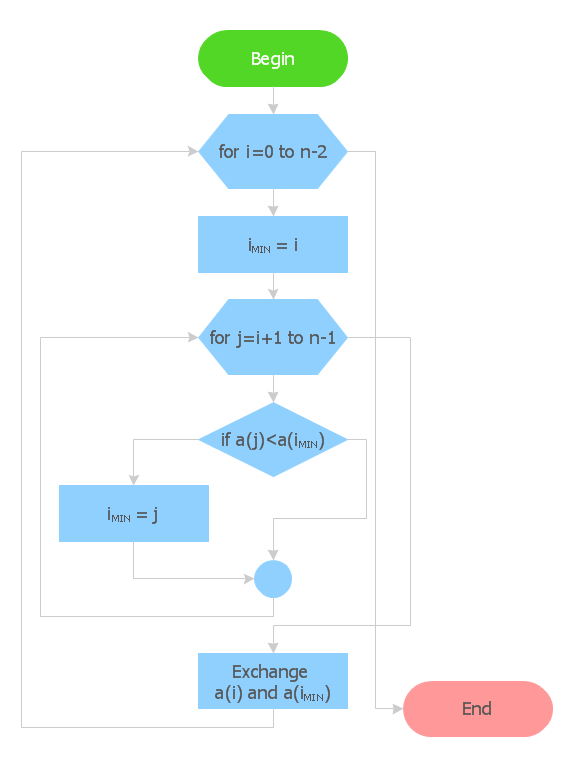
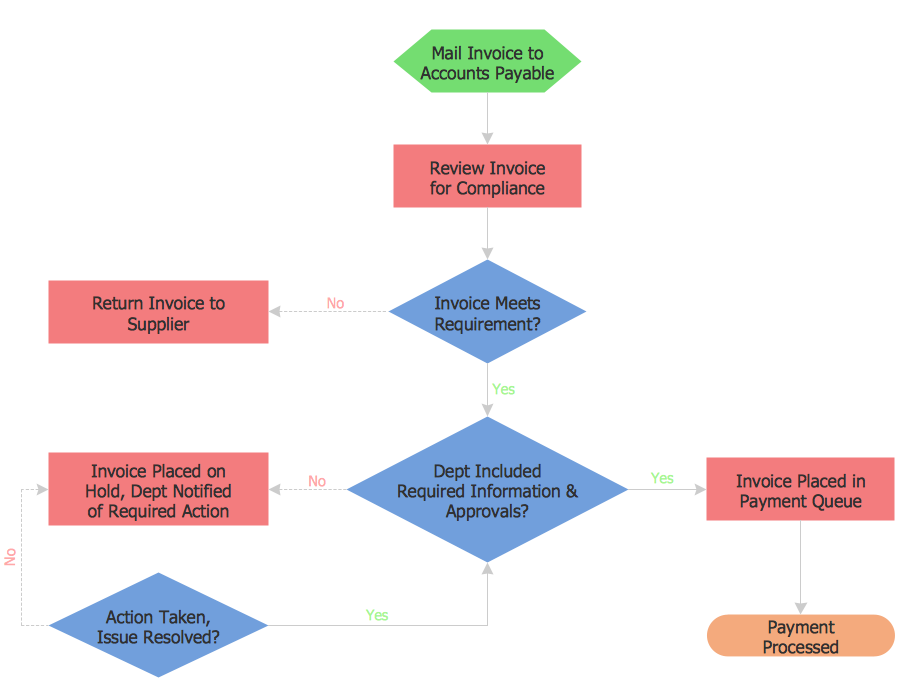
How to Create Flowchart Using Standard Flowchart Symbols
Flowcharts are used to display an algorithm for consistent execution of certain steps. Flowchart is probably the easiest way to make a graphical representation of any process. Flowcharts use the set of standard geometric symbols and arrows to define relationships. ConceptDraw PRO allows you to create professional flowchart quickly and easily. The ability to create flowcharts is contained in the Flowcharts solution. The solution provides a set of special tools for creating flowcharts.HelpDesk
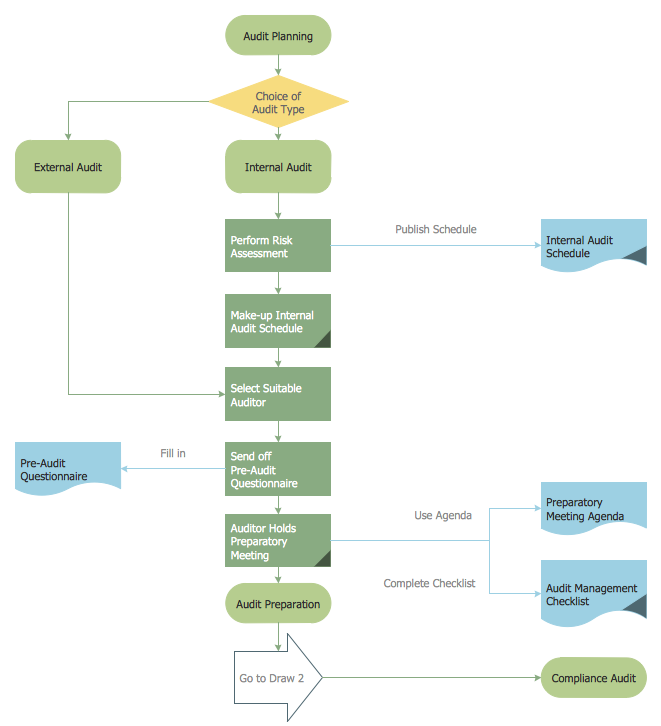
How to Create an Audit Flowchart Using ConceptDraw PRO
Audit flowcharts are often used in auditors activity. This is the most effective way of preparation and documentation of the audit process. Financial audit process has a clear structure, and therefore audit flowchart is often used to denote an audit process. This is the most effective way of preparation and documentation of the audit process. Flowcharts are often used in auditors activity. A flowchart may be created at any stage of an audit process as an aid in the determination and evaluation of a client's accounting system. ConceptDraw PRO allows you to create professional accounting flowchart quickly using the professional Audit Flowcharts solution.HelpDesk
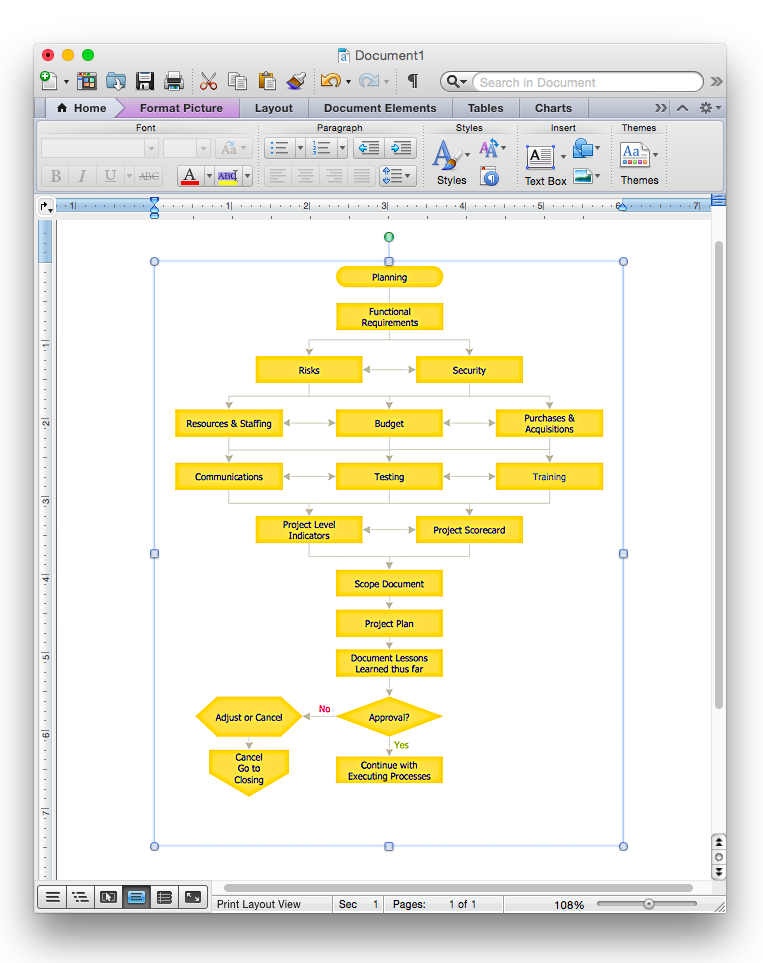
How to Add a Flowchart to a MS Word Document Using ConceptDraw PRO
ConceptDraw PRO allows you to easily create flowcharts and then insert them into a MS Word document.HelpDesk
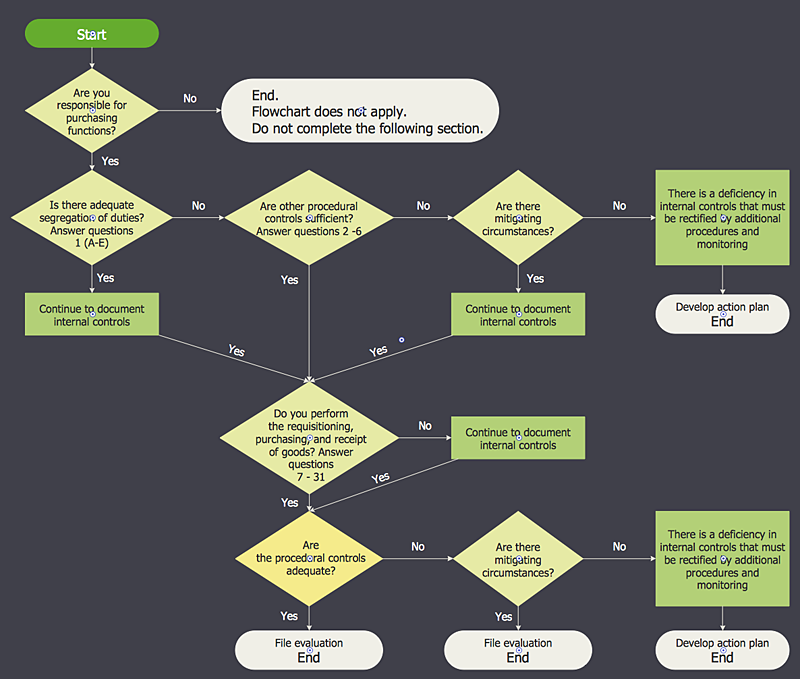
How to Create an Accounting Flowchart Using ConceptDraw Solution Park
An Accounting flowchart is a specialized type of flowchart. With the help of an accounting flowchart you can visually describe tasks, documents, people responsible for execution at each stage of accounting workflow. Find out how you can easily create an accounting flowchart of any complexity using Accounting Flowchart Solution from the ConceptDraw Solution Park.HelpDesk
Software for Flowchart Diagrams
There are many types of flowcharts among them are work flow diagram, data flow diagram, business flow diagram and other very complex flowcharts. Thus to draw flowchart it is better to use computer program – a software for flowchart diagrams creation. The best flowchart software - is ConceptDraw PRO. With the help of ConceptDraw visual solutions, you can quickly and effortlessly portray even the most complex business process flow. ConceptDraw Flowchart solutions deliver a special set of vector stencils that contains all standard symbols of flowchart notation, and a large number of special symbols intended for business-oriented flowcharts.HelpDesk
How to Draw a Pictorial Chart in ConceptDraw PRO
Pictorial Infographics is used to visually present data comparison. Pictorial charts use relative sizes or repetitions of the same icon, picture, or symbol to show data relation. Using a Pictorial chart to show business data patterns and trends will add much more efficiency to your business communications. Finding the right tool for the job can sometimes be tricky. Developing sophisticated and effective infographics can require toolsthat may span many different products. Fortunately, ConceptDraw PRO has everything you need to create polished Pictorial Infographics that beautifully and accurately represent your story, no matter how complex it may be.HelpDesk
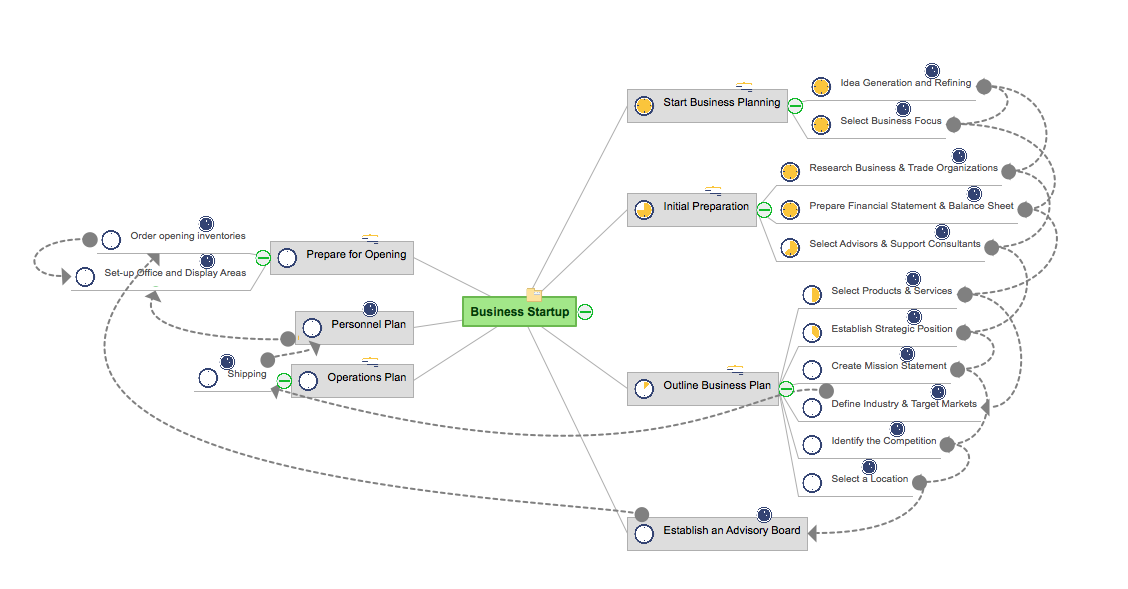
How to Make a Mind Map from a Project Gantt Chart
ConceptDraw Office allows you to see the project data from ConceptDraw PROJECT in a mind map structure by opening your project in ConceptDraw MINDMAP.HelpDesk
How to Create a Timeline Diagram in ConceptDraw PRO
A Timeline is a chart which displays a project plan schedule in chronological order. A Timeline is used in project management to depict project milestones and visualize project phases, and show project progress. The graphic form of a timeline makes it easy to understand critical project milestones, such as the progress of a project schedule. Timelines are particularly useful for project scheduling or project management when accompanied with a Gantt chart. It captures the main of what the project will accomplish and how it will be done. making a project timeline is one of the most important skills a project manager needs have. Making comprehensive, accurate timelines allows you getting every project off in the best way. ConceptDraw PRO allows you to draw a timeline charts using special library.HelpDesk
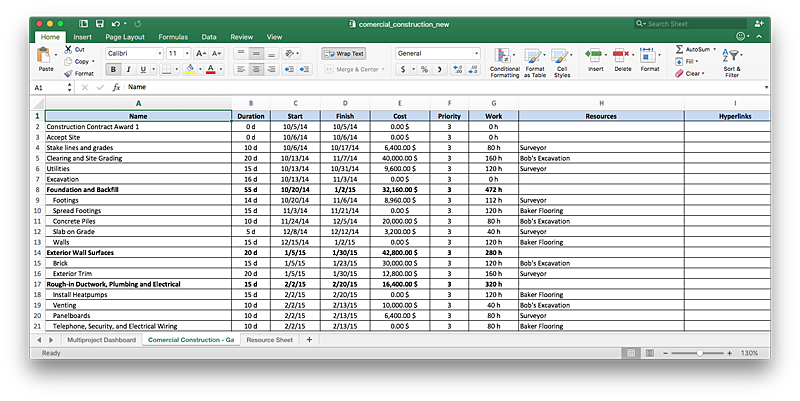
How to Export Project Data to MS Excel Worksheet
You can share your ConceptDraw PROJECT files with colleagues who use MS Excel®using the export capabilities of ConceptDraw PROJECT.- Project Phase Flow Chart Sample
- Project Phases Flow Chart In Jpeg
- Process Flowchart | Sample Project Flowchart . Flowchart Examples ...
- Project management life cycle - Flowchart | Sample Project ...
- Basic Flowchart Symbols and Meaning | Audit Flowchart Symbols ...
- Sample Project Flowchart . Flowchart Examples | Flowchart ...
- Sample Project Flowchart . Flowchart Examples | Project planning ...
- Project planning diagram | Project planning process - Flowchart ...
- Types of Flowchart - Overview | Process Flowchart | HR ...
- Software Work Flow Process in Project Management with Diagram ...
- Project management life cycle - Flowchart | Project planning process ...
- Project management life cycle - Flowchart | Process Flowchart ...
- Project planning process - Flowchart | Software Work Flow Process ...
- Process Flowchart | Sample Project Flowchart . Flowchart Examples ...
- Process Flowchart | Project planning process - Flowchart | Flow ...
- Flow process chart | Flow Chart for Olympic Sports | How are ...
- Project schedule | Flowchart
- Process Flowchart | Sample Project Flowchart . Flowchart Examples ...
- Block diagram - Planning process | Project planning process ...
- Work Flow Chart Projects

