"Solution selling is a sales methodology. Rather than just promoting an existing product, the salesperson focuses on the customer's pain(s) and addresses the issue with his or her offerings (product and services). The resolution of the pain is what constitutes a "solution". ...
Followers of "solution-selling" generally apply a consultative sales approach to all aspects of their sales process (or during a sales cycle) including:
Prospecting;
Diagnosing customer needs;
Crafting a potential solution;
Establishing value;
Bargaining for access to decision-makers;
Positioning proof, ROI and the total solution;
Negotiating a win-win solution;
Following up to ensure customer success.
The solution selling methodology has evolved as key components of professional selling evolve. As a result, solution selling has become more broadly defined - to include dimensions of "sales process", "competitive selling", "value selling" as well as "consultative selling" or "complex selling" which set the focus on the team's aspects of the sales." [Solution selling.Wikipedia]
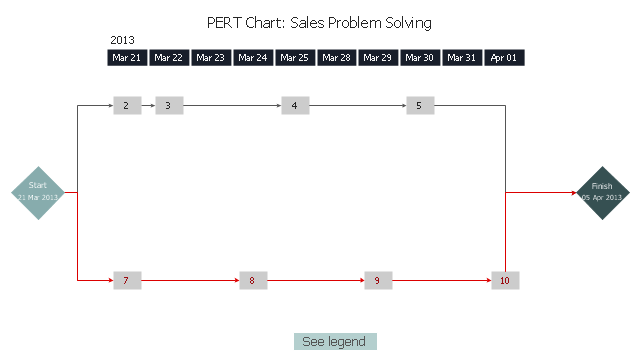
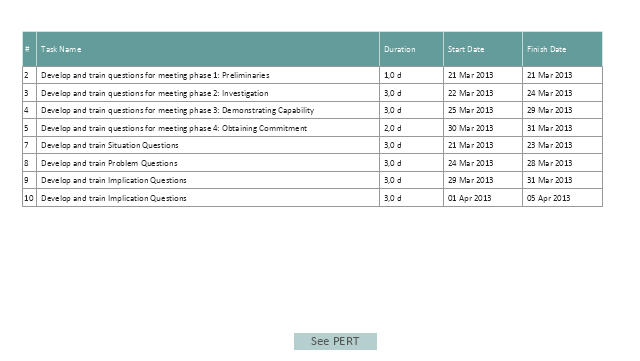
The PERT chart example "Sale problem solution" was created using the ConceptDraw PRO diagramming and vector drawing software extended with the solution Seven Management and Planning Tools from the Management area of ConceptDraw Solution Park.
Followers of "solution-selling" generally apply a consultative sales approach to all aspects of their sales process (or during a sales cycle) including:
Prospecting;
Diagnosing customer needs;
Crafting a potential solution;
Establishing value;
Bargaining for access to decision-makers;
Positioning proof, ROI and the total solution;
Negotiating a win-win solution;
Following up to ensure customer success.
The solution selling methodology has evolved as key components of professional selling evolve. As a result, solution selling has become more broadly defined - to include dimensions of "sales process", "competitive selling", "value selling" as well as "consultative selling" or "complex selling" which set the focus on the team's aspects of the sales." [Solution selling.Wikipedia]
The PERT chart example "Sale problem solution" was created using the ConceptDraw PRO diagramming and vector drawing software extended with the solution Seven Management and Planning Tools from the Management area of ConceptDraw Solution Park.
PERT
Legend
CORRECTIVE ACTIONS PLANNING. PERT Chart


PERT Chart

Root Cause Analysis

Corrective Action Planning

Problem Analysis

 Seven Management and Planning Tools
Seven Management and Planning Tools solution extends ConceptDraw PRO and ConceptDraw MINDMAP with features, templates, samples and libraries of vector stencils for drawing management mind maps and diagrams.
Venn Diagram Examples for Problem Solving. Venn Diagram as a Truth Table

The Action Plan

Preventive Action
 - Minimization-of-material-wastage")
Decision Making

Problem solving

 Seven Management and Planning Tools
Seven Management and Planning Tools solution extends ConceptDraw PRO and ConceptDraw MINDMAP with features, templates, samples and libraries of vector stencils for drawing management mind maps and diagrams.
PROBLEM ANALYSIS. Root Cause Analysis Tree Diagram

CORRECTIVE ACTIONS PLANNING. Involvement Matrix

- Pert Problems And Solutions
- PERT chart - Sale problem solution | Sales Process Flowchart ...
- PERT chart - Sale problem solution | CORRECTIVE ACTIONS ...
- Pert Analysis Problems And Solutions
- Pert Cpm Example Problems With Solution
- Pert Problem Solution Video
- Cpm Problems With Solution
- Problem And Solution Of Pert Analysis
- Problems On Pert And Cpm Work Solutions
- Pert Example Problem And Solution
- PERT chart - Project management plan | PERT chart - Template ...
- Pert Problem With Solutions
- PERT chart - Template | PROBLEM ANALYSIS. Prioritization Matrix ...
- Cpm And Pert Problems With Solutions
- Venn Diagram Examples for Problem Solving. Venn Diagram as a ...
- Pert Chart Example Problem
- Problem Solution Chart
- Example Of A Chart Problem Solution And Tools
- Pert Problem With Solution
- Bar Diagrams for Problem Solving. Create economics and financial ...