Value Stream Map
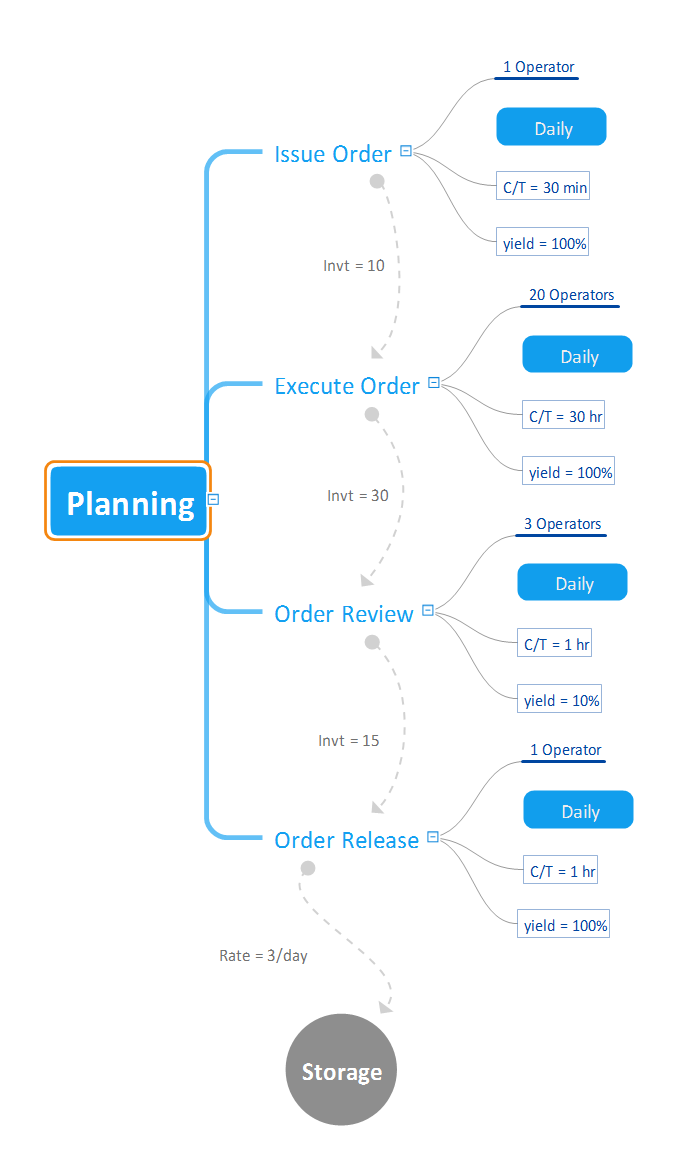
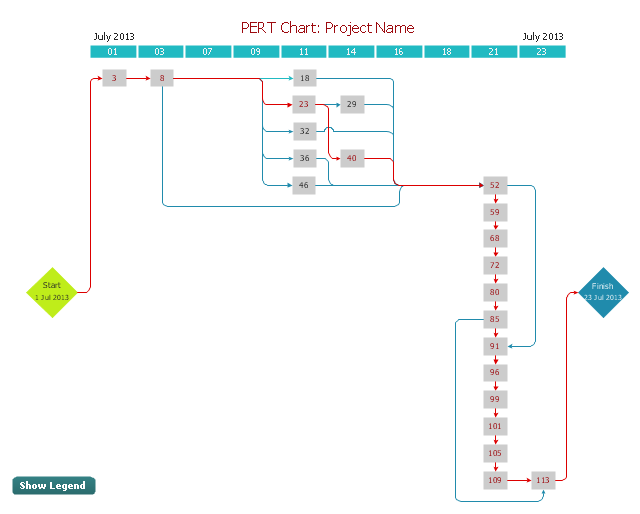
Value stream mapping is a well-known lean manufacturing and lean management method of depiction, analyzing and improvement the current state of flow of manufacturing and production process, of designing a future state for the serie of events that occur with product during the long way from the beginning to customer. Value stream map helps a manufacturing team to represent visually the flow of materials through the process, as well as the flow of information required to deliver a product or a service from the supplier to customer. Value stream map is a first step on the way to ideal state of organization due to the possibility to detect immediately the process delays, to analyze and identify the potential process improvement opportunities, to identify the waste in a process and to minimize them. The Mind Maps are widely applied in lean manufacturing and management. This Mind Map created using the powerful tools of ConceptDraw MINDMAP software demonstrates how the Value Stream Map can be represented as a mind map."A project network is a graph (flow chart) depicting the sequence in which a project's terminal elements are to be completed by showing terminal elements and their dependencies.
... the project network shows the "before-after" relations.
The most popular form of project network is activity on node, the other one is activity on arrow.
The condition for a valid project network is that it doesn't contain any circular references." [Project network. Wikipedia]
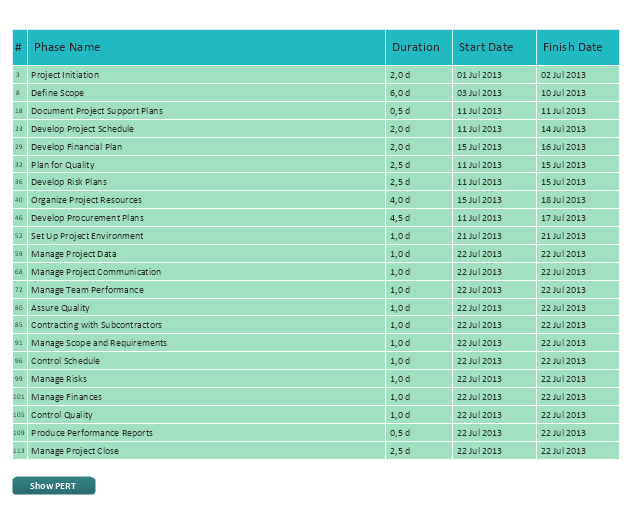
The PERT chart example "Project management plan" was created using the ConceptDraw PRO diagramming and vector drawing software extended with the solution "Seven Management and Planning Tools" from the Management area of ConceptDraw Solution Park.
Process Flow Chart Software Free
How to draw a Process Flow Chart? It's very fast and easy to draw any Process Flow Chart using the tools of special Process Flow Chart software free. Flowcharts Solution offers wide set of useful drawing tools, collection of samples, ready-to-use template and 2 libraries with predesigned vector elements which will help facilitate drawing process and designing professional looking process flow chart, process flow scheme, process block diagram, etc.Symboles Organigramme
Les organigrammes sont parfaits pour représenter visuellement des processus operationnels. Par exemple, si vous avez besoin d'afficher le flux d'un processus d'ordre personnalisé par l'entremise de divers opérateurs au sein de votre organisation, vous pouvez utiliser un organigramme. Voir aussi d'autres symboles organigramme: Symboles ordinogramme standard, symboles du flux de travail, Vérification Les symboles du schéma fonctionnel, sOrganigramme comptables des symboles, Organigramme de vente des symboles, Symboles pour organigramme des RH, Carte des symboles de processus, Diagramme de processus opérationnels, Symboles utilisés dans le schéma IDEF0.Business diagrams & Org Charts with ConceptDraw DIAGRAM
The business diagrams are in great demand, they describe the business processes, business tasks and activities which are executed to achieve specific organizational and business goals, increase productivity, reduce costs and errors. They let research and better understand the business processes. ConceptDraw DIAGRAM is a powerful professional cross-platform business graphics and business flowcharting tool which contains hundreds of built-in collections of task-specific vector stencils and templates. They will help you to visualize and structure information, create various Business flowcharts, maps and diagrams with minimal efforts, and add them to your documents and presentations to make them successful. Among them are Data flow diagrams, Organization charts, Business process workflow diagrams, Audit flowcharts, Cause and Effect diagrams, IDEF business process diagrams, Cross-functional flowcharts, PERT charts, Timeline diagrams, Calendars, Marketing diagrams, Pyramids, Target diagrams, Venn diagrams, Comparison charts, Analysis charts, Dashboards, and many more. Being a cross-platform application, ConceptDraw DIAGRAM is very secure, handy, free of bloatware and one of the best alternatives to Visio for Mac users.
What is a Quality Management
Successful quality management implemented in a company of any size is a critical component of a company organization.Cross-Functional Flowchart Basics
Don't let your first glance fool you. ConceptDraw is a lot easier to use than it looks. Use its cross-functional templates and library as basics to get started. All you need to know are a few basic steps and terms. ConceptDraw Arrows10 Technology is a new age in drawing software. Use it for process flows and its new rapid draw feature enables to draw an impressive charts in a seconds.Wireless Network Drawing
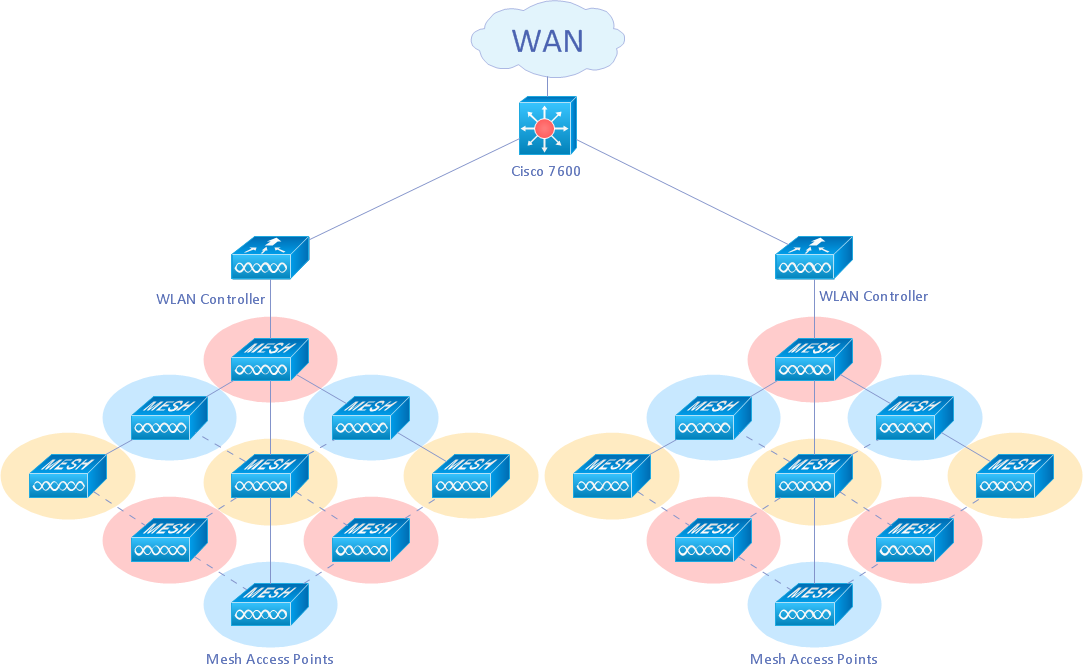
The Wireless Network solution helps users to quickly transition from an idea to the implementation of a wireless computer network. ConceptDraw DIAGRAM is well placed to provide experienced and comprehensive assistance in the workplace. The vector stencils, examples, and templates included to solution is a strong toolset for network engineer.Sales Process Steps
Sales process engineering is a complex and labour-intensive process which requires a lot of time, efforts, and powerful software. We recommend to use the ConceptDraw DIAGRAM software enhanced with Sales Flowcharts solution from the Marketing area of ConceptDraw Solution Park. It gives the possibility to easy illustrate all sales process steps and their results.Windows Azure
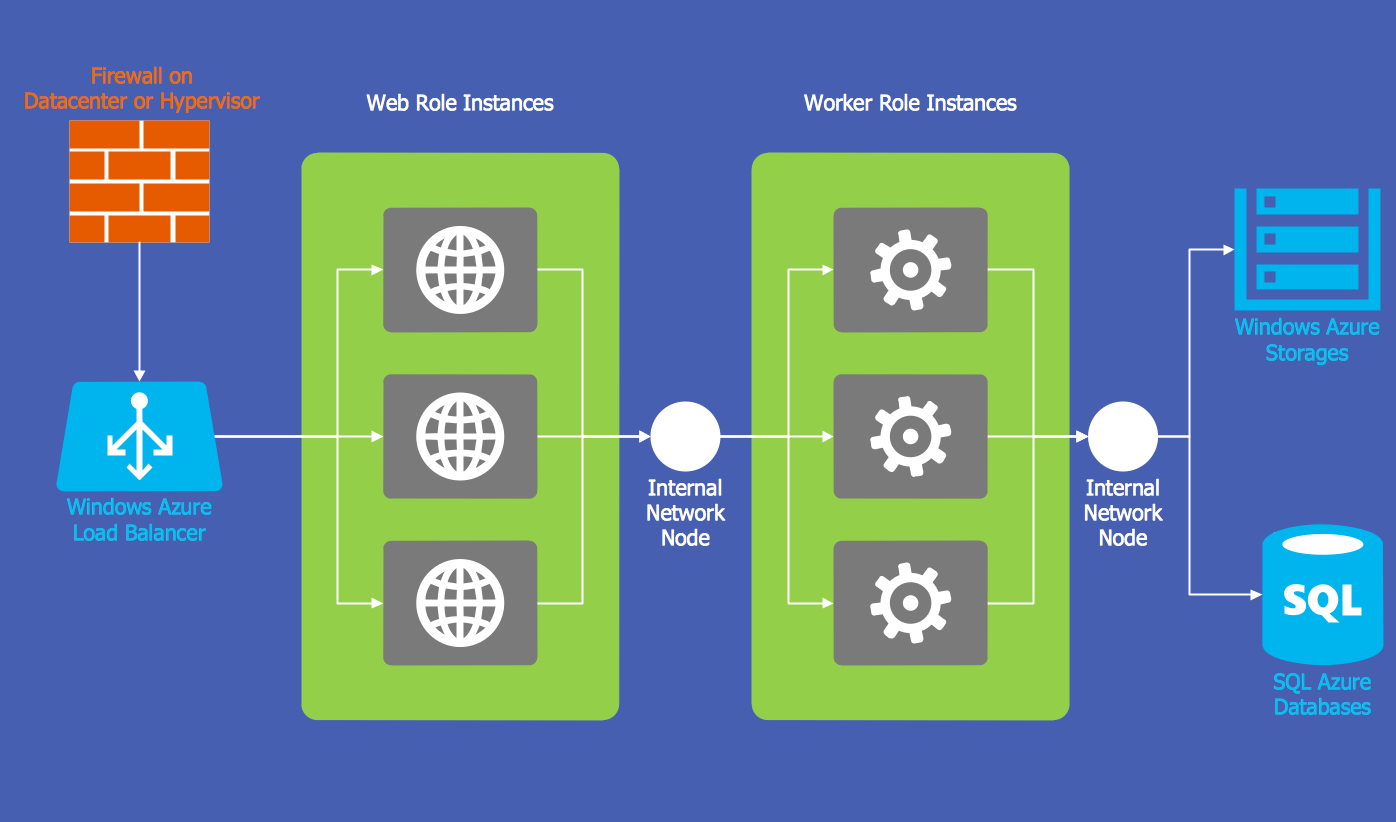
The Microsoft Windows Azure platform is a highly flexible cloud-based solution with variety of services which supports not only the execution of.NET applications, but also allows developers to use programming languages like Java, PHP, Node.js, or Python. ConceptDraw DIAGRAM diagramming and vector drawing software provides the Azure Architecture Solution from the Computer and Networks area of ConceptDraw Solution Park with a lot of useful tools which make easier: illustration of Windows Azure possibilities and features, describing Windows Azure Architecture, drawing Azure Architecture Diagrams, depicting Azure Cloud System Architecture, describing Azure management, Azure storage, documenting Azure services.- How To Create a PERT Chart Using PM Easy Solution | PERT chart ...
- How To Create a PERT Chart | PERT chart - Template | PERT chart ...
- PERT chart - Project management plan
- Business diagrams & Org Charts with ConceptDraw DIAGRAM ...
- Dfd Of C To C Online Shopping
- Process Flowchart | Activity Network ( PERT ) Chart | Basic Flowchart ...
- Quality fishbone diagram - Template | Cause and Effect Diagrams ...
- Atmosphere air composition | EU greenhouse gas emissions ...
- SWOT Matrix Template | How To Create an HR Metric Dashboard ...
- UML activity diagram - Deposit slip processing | UML Diagram Tool ...
- Social determinants of health | PDPC | Flowchart Examples and ...
- Solving quadratic equation algorithm - Flowchart | | Euclidean ...
- Network Topology Mapper | Example of DFD for Online Store (Data ...
- How to Use the Effort-Driven Scheduling Method | Project planning ...
- Flowchart Software | Diagramming Software for Design UML Activity ...
- Business Process Mapping — How to Map a Work Process ...
- Seven Management and Planning Tools | Business Processes ...
- Fault Tree Diagram | Process Flowchart | Basic Flowchart Symbols ...
- SWOT Matrix | SWOT Matrix Software | Ansoff Matrix | What Is Tows ...
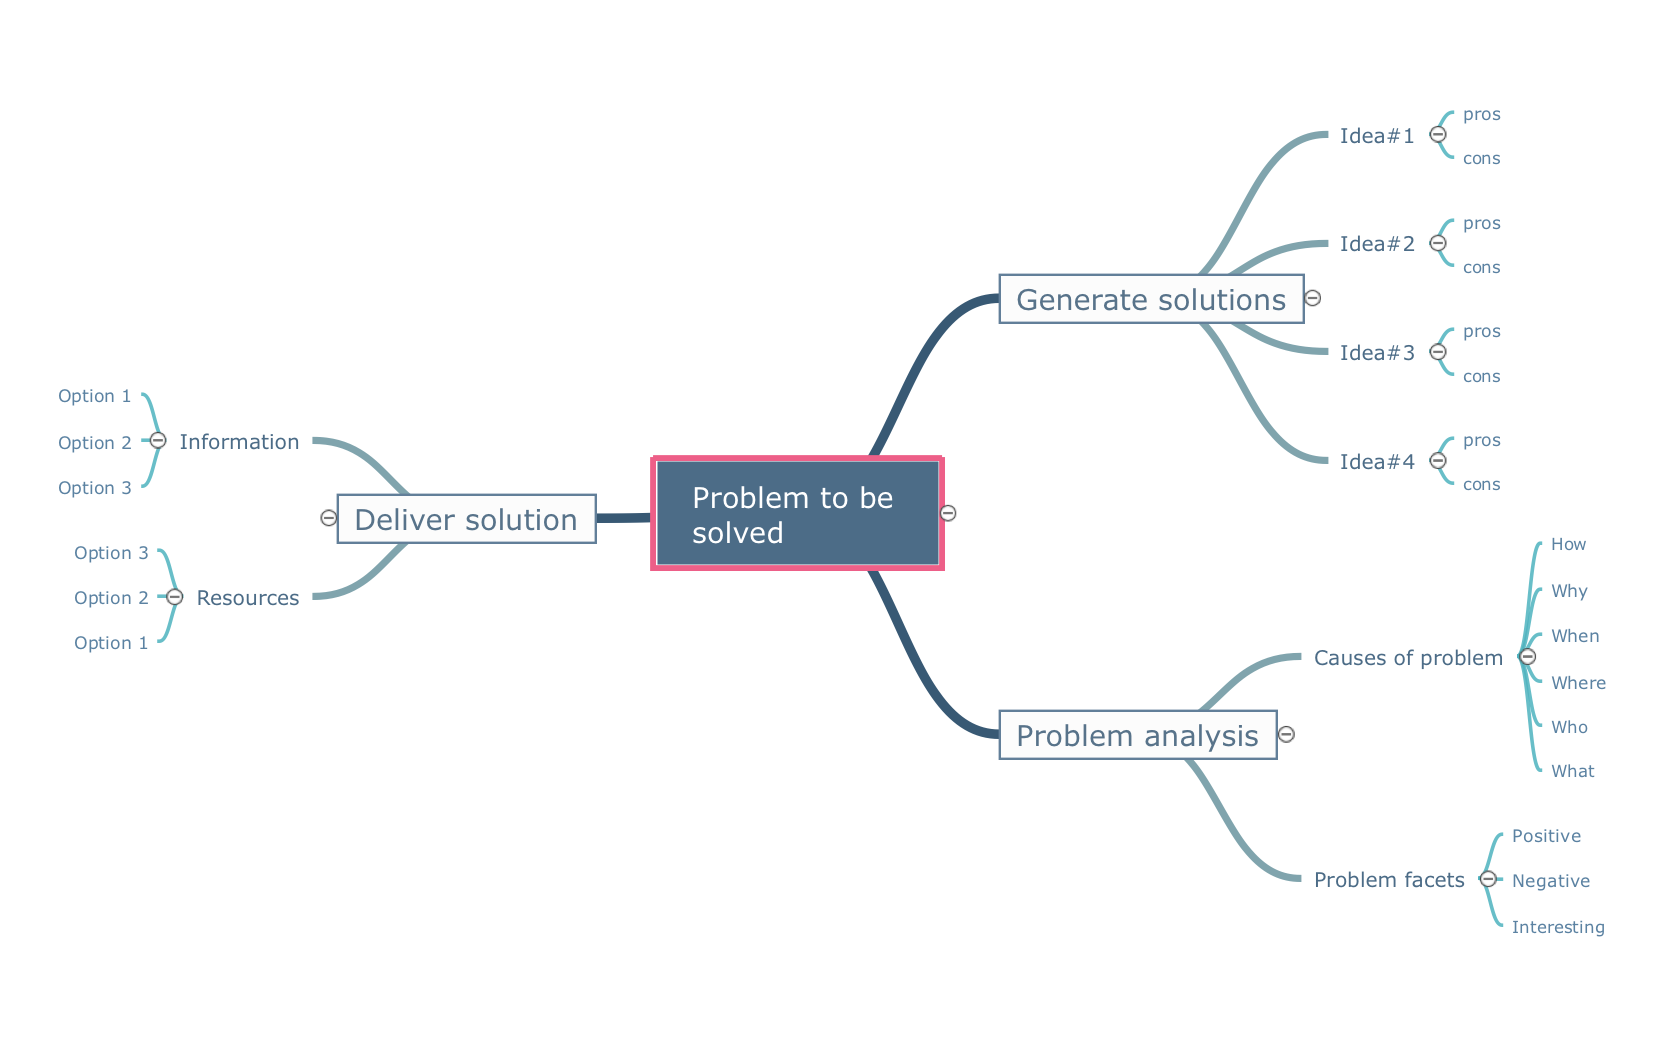
- The Action Plan | Corrective Action Planning | PROBLEM ANALYSIS ...
