Types of Flowchart - Overview


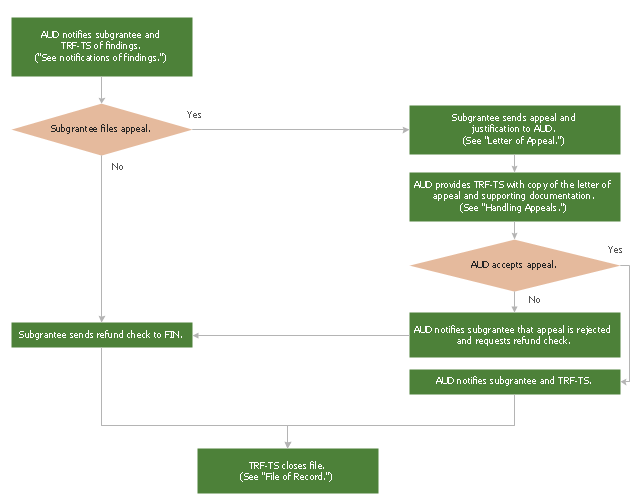
This audit flowchart sample was created on the base of the figure illustrating the webpage "Section 5: Resolving Audit Findings Pertaining to Site Audits" from the website of TxDOT Online Manuals.
"Site Audits.
In addition to audit coverage utilizing the single audit approach, The Texas Department of Transportation (TxDOT) Audit Office (AUD) conducts requested site audits each year on selected projects. Site audits are handled using AUD’s normal site audit procedures. AUD forwards any findings noted during the audit directly to the subgrantee for collection of the moneys due or other resolution as appropriate. Information copies are provided to the TRF-TS program managers and to the districts when appropriate." [onlinemanuals.txdot.gov/ txdotmanuals/ tfc/ resolving_ audit_ findings_ pertaining_ to_ site_ audits.htm]
The audit flowchart example "Overview of resolution process following an Audit Office finding" was created using the ConceptDraw PRO diagramming and vector drawing software extended with the Audit Flowcharts solution from the Finance and Accounting area of ConceptDraw Solution Park.
www.conceptdraw.com/ solution-park/ finance-audit-flowcharts
Audit flowchart

Database Flowchart Symbols

Basic Audit Flowchart. Flowchart Examples

Cross-Functional Flowcharts in ConceptDraw

Cross-Functional Flowchart


Account Flowchart Stockbridge System. Flowchart Examples

Example of DFD for Online Store (Data Flow Diagram) DFD Example


Technical Flow Chart

UML Flowchart Symbols

Work Flow Process Chart

Samples of Flowchart

DFD Flowchart Symbols

Flow Chart Online

- Types of Flowcharts | Types of Flowchart - Overview | Basic ...
- Overview | Flow chart Example. Warehouse
- Flowchart Programming Project. Flowchart Examples | Process ...
- Process Flowchart | Flow chart Example. Warehouse Flowchart ...
- How to Create a HR Process Flowchart Using ConceptDraw PRO ...
- HR management process - Flowchart | Types of Flowchart ...
- Types of Flowchart - Overview | Process Flowchart | HR ...
- Process Flowchart | Types of Flowchart - Overview | Flow chart ...
- Process Flowchart | Types of Flowchart - Overview | Types of ...
- Types of Flowchart - Overview | Basic Flowchart Symbols and ...
- Process Flowchart | Basic Flowchart Symbols and Meaning | Types ...
- Types of Flowchart - Overview | ConceptDraw Solution Park ...
- Types of Flowchart - Overview | HR Flowcharts | HR Flowchart ...
- Types of Flowchart - Overview | How to Create a HR Process ...
- Types of Flowchart - Overview | Accounting Flowcharts | Process ...
- Types of Flowchart - Overview | Human Resource Management ...
- Types of Flowchart - Overview | Process Flowchart | Flow chart ...
- Types of Flowchart - Overview | How to Resize Objects ...
- Basic Flowchart Symbols and Meaning | Types of Flowchart ...
- Process Flowchart | Types of Flowchart - Overview | Model Based ...