ConceptDraw PRO - Organizational chart software
Organizational Chart is a scheme which visualizes the composition of departments, sectors and other functional units of an organization, and also fixed relationships that exist between divisions and employees. ConceptDraw PRO enhanced with Organizational Charts solution is a powerful and cost effective Organizational chart software, which allows to automate the process of creation the high standard organizational charts, flow charts, time lines, and much more diagrams. It can be applied for analyzing organizational structure and drawing single or multi-page Organizational Charts with hyperlinks for the companies of any type, size and direction. Visualize the structure using the orgchartal tools, create easily as never before the Company Organizational Chart, Corporate Organizational Chart, Hospital Organizational Chart, University Organizational Chart, Hotel Organizational Chart, and then export, send by e-mail or publish it on Web in minutes, to communicate and discuss with colleagues or any other interested people.Orgchart
Workforce planning is strategically important for each company, organization, enterprise, and corporation, non important it is business, commercial, non-profit or government organization. Organizational Chart or Orgchart is a type of diagram that is successfully used to graphically illustrate the structure of an organization and also relationships between its parts. There are three different types of Orgcharts: hierarchical, matrix and flat. ConceptDraw PRO diagramming and vector drawing software supplied with Organizational Charts Solution from Management Area is the best for easy designing professional-looking Orgcharts. This solution provides you the predesigned samples and Organizational Chart library with ready-to-use vector objects required for Orgchart design. It also offers the most simple way of drawing - the possibility to start with one of built-in Orgchart templates. Typically Orgcharts require for regular updating and making modifications, in ConceptDraw PRO it is fast and easy, the blocks are editable and remain connected when they are moved.Organization Chart Software
Create Organizational Chart Software - You need create Organizational Chart? Nothing could be easier with ConceptDraw PRO diagramming and vector drawing software. ConceptDraw PRO presents the Organizational Charts Solution from the Management Area that will allow you to draw the Organization Charts of any difficulty easy and quick.
Marketing and Sales Organization chart. Organization chart Example
The use of Organization Charts is very popular at the fields of marketing and sales. They help to depict in a visual form a lot of information about organization: the company's structure, relationships of positions within an organization in terms of authorities and responsibilities, and company's strategies. All Organizational Charts are constructed from the similar building blocks (rectangles and lines), this makes them easily for interpretation and understanding by all interested people inside and outside of this company, such as shareholders, employees, investors, distributors, suppliers, customers, etc. Organization Charts can be hand-drawn on the paper, however the preferable is to use a special software. ConceptDraw PRO diagramming and vector graphics software extended with useful Organizational Charts solution is ideal for easy representing information and data, and professional drawing Marketing and Sales Organization Chart with any depth of detailing. Organizational structure may differ during the company's development, you can design and compare the charts on each stage.Organizational Structure Diagram Software
ConceptDraw PRO extended with Organizational Charts Solution from the Management Area is a powerful but easy-to-use Organizational Structure Diagram Software. Organizational Charts Solution provides a wide variety of templates and samples and large quantity of predesigned vector objects to help you design your Organizational Structure Diagrams and other business diagrams.
Organizational Chart Templates
ConceptDraw offers you a number of ready-made organizational chart templates which you can use in your drawing. They are grouped in topical sets as organizational chart template files. Use the Organizational Charts Solution for ConceptDraw PRO to create your own Organizational Charts of any complexity quick, easy and effective. The Organizational Charts designed with ConceptDraw PRO are vector graphic documents and are available for reviewing, modifying, converting to a variety of formats (image, HTML, PDF file, MS PowerPoint Presentation, Adobe Flash or MS Visio XML), printing and send via e-mail in one moment.
Organizational Chart
An organizational chart is a diagram that shows the structure of an organization and the relationships of its parts. ConceptDraw PRO extended with Organizational Charts Solution from the Management Area is powerful Organizational Chart Software.Marketing Organization Chart
You need design the Marketing Organization Chart and look for effective software? Now it's incredibly easy to do this in ConceptDraw PRO which was supplied with Marketing Diagrams Solution from the Marketing Area of ConceptDraw Solution Park.Business Processes
The most worked out and commonly used methodology of business processes description is IDEF methodology. Besides business processes it allows to describe functional blocks, for example production and marketing. ConceptDraw lets creation of business processes description using IDEF0 and IDEF2 methods.Applications
ConceptDraw PRO is a multipurpose software from ConceptDraw suite intended for diagramming, business and technical drawing, and visual documenting. You can reach a lot of practical benefits from the use of ConceptDraw PRO. The list of ConceptDraw PRO applications and versatile possibilities is extremely great. Among them network and system diagramming, business diagramming, Cisco network design, network visualization, software and database design, software development, business flowcharting, data flow design, databases modeling and visualization, business processes modeling, business drawing, technical drawing, GUI prototyping, Organizational charts construction, business processes fixing, web site planning and design, Internet solutions design, information architecture design, UML modeling, ER diagrams design, home and landscape design, and a lot of other applications. ConceptDraw PRO offers the users a beneficial collaboration, compatibility with MS Visio and many other popular programs, including other products from ConceptDraw suite.Basic Flowchart Symbols and Meaning
Flowcharts are the best for visually representation the business processes and the flow of a custom-order process through various departments within an organization. ConceptDraw PRO diagramming and vector drawing software extended with Flowcharts solution offers the full set of predesigned basic flowchart symbols which are gathered at two libraries: Flowchart and Flowcharts Rapid Draw. Among them are: process, terminator, decision, data, document, display, manual loop, and many other specific symbols. The meaning for each symbol offered by ConceptDraw gives the presentation about their proposed use in professional Flowcharts for business and technical processes, software algorithms, well-developed structures of web sites, Workflow diagrams, Process flow diagram and correlation in developing on-line instructional projects or business process system. Use of ready flow chart symbols in diagrams is incredibly useful - you need simply drag desired from the libraries to your document and arrange them in required order. There are a few serious alternatives to Visio for Mac, one of them is ConceptDraw PRO. It is one of the main contender with the most similar features and capabilities.
HelpDesk
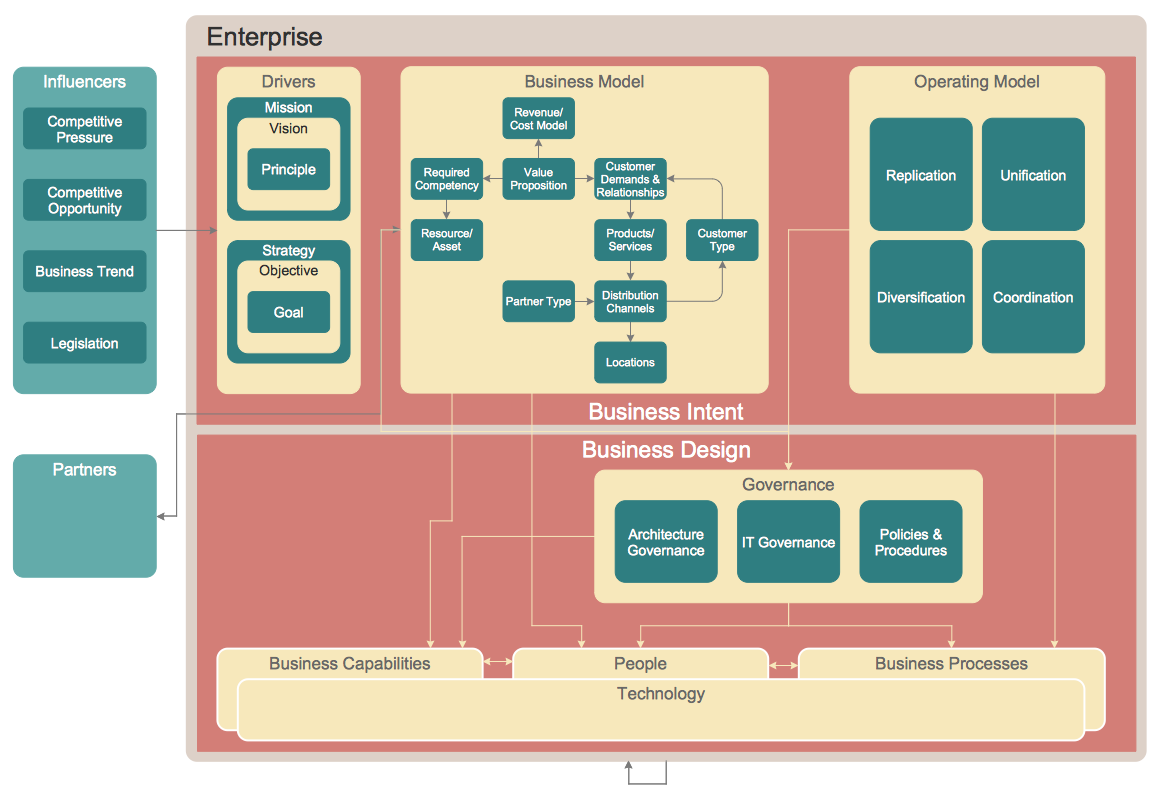
How to Create an Enterprise Architecture Diagram in ConceptDraw PRO
An Enterprise Architecture (EA) diagram is used to display the structure and operations of an organization.It is used to analyze and document an organization and its business functions, along with the applications and systems on which they are implemented. The aim of an enterprise architecture diagram is to determine how an organization can effectively achieve its current and future objectives. The Enterprise Architecture often uses diagrams to support the decision-making process. ConceptDraw PRO allows you to design Enterprise Architecture diagrams of any complexity.HelpDesk
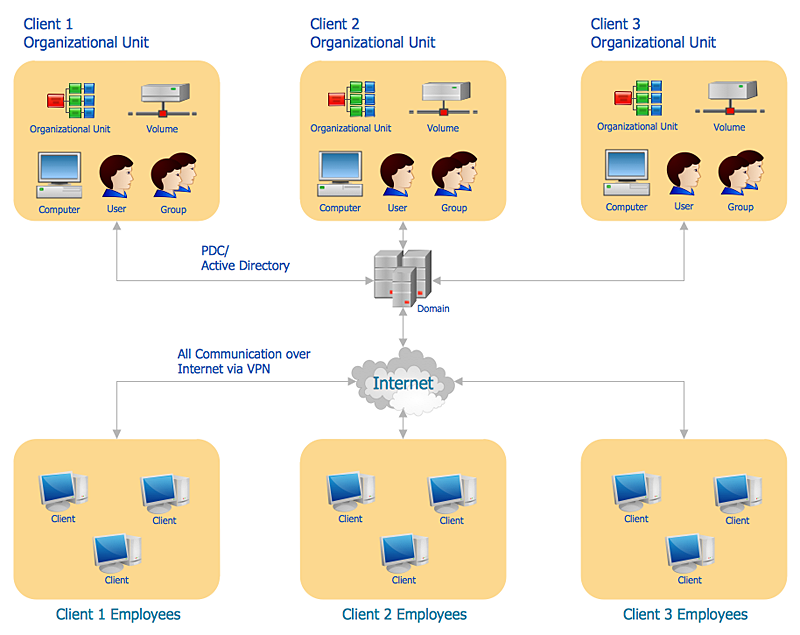
How to Create an Active Directory Diagram in ConceptDraw PRO
Active Directory Service represents a distributed database that contains all the domain objects. The Active Directory domain environment is a single point of authentication and authorization of users and applications across the enterprise. The domain of the organization and deployment of Active Directory Service are exactly the cornerstones of the enterprise IT infrastructure. The logical diagrams of MS Windows Active Directory structure are used to visually support an enterprise IT infastructure planning and management. ConceptDraw PRO allows you to make AD Diagrams quickly and easily using the set of special libraries.HelpDesk
Event-driven Process Chain (EPC) Diagram Software
An EPC diagram is a type of flowchart used in business process analysis. It shows different business processes through various work flows. The workflows are shown as processes and events that are related to different executes and tasks that allow business workflow to be completed. An EPC diagram shows different business processes through various workflows. The workflows are seen as functions and events that are connected by different teams or people, as well as tasks that allow business processes to be executed. The best thing about this type of enterprise modelling is that creating an EPC diagram is quick and simple as long as you have the proper tool. One of the main usages of the EPC diagrams is in the modelling, analyzing and re-engineering of business processes. With the use of the flowchart, businesses are able to see inefficiencies in the processes and modify to make them more productive. Event-driven process chain diagrams are also used to configure an enterprise resource plaHelpDesk
How to Draw a Pie Chart Using ConceptDraw PRO
A pie chart represents data, in a clear and easy to read round (pie) form. A circular pie chart is divided into sections (slice). Each "slice" depicts the It reflects the proportion of each component in the whole "pie". This type of chart is most often used for the visualization of statistical data. That is why pie charts are widely used in marketing. As pie charts show proportional proportional parts of a whole, they are good for various visual comparisons. For example, it is difficult to imagine a more intuitive way to show segmentation and market share. ConceptDraw PRO allows you to draw a simple and clear Pie Chart using the Pie Charts solution.HelpDesk
How to Draw the Different Types of Pie Charts
Using the Pie Chart, you can visually estimate the relative contribution that different data categories contribute to a whole value. The pie chart displays the statistics in a visual format. The main use of pie charts to show comparisons. The larger piece of the pie, the more the value of this value compared to the rest. Various applications of pie charts can be found in business and education. For business, pie charts can be used to compare the success or failure of the goods or services. They may also be used to display the business market share.HelpDesk
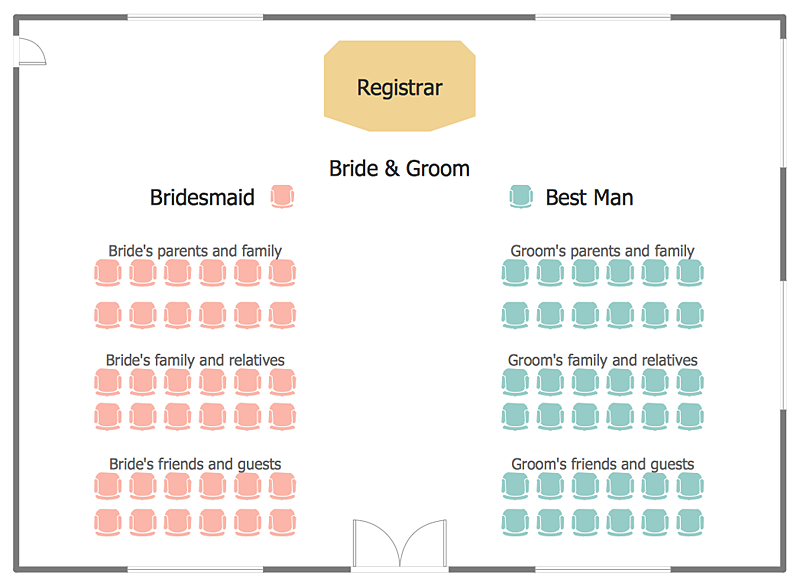
How to Create a Seating Chart for Wedding or Event
Making the guests invited to a wedding or any other special event feel as comfortable as possible, you necessary to take care of the preparation of the seating arrangements plan. That is why it is important to make a detailed table seating chart that will carefully positioning any invitee. Making a Seating Chart template with a help of seating chart software is the best way to represent and prepare a seating plan, for event participants and guests. The ability to design different seating plans is delivered by the ConceptDraw Seating Plans solution. Using ConceptDraw PRO simplifies the complex and cumbersome process of public events organization.HelpDesk
How to Draw a Chemical Process Flow Diagram
Process Flow Diagram widely used in modeling of processes in the chemical industry. A Chemical Process Flow diagram (PFD) is a specialized type of flowchart. With the help of Chemical Process Flow Diagram engineers can easily specify the general scheme of the processes and chemical plant equipment. Chemical Process Flow Diagram displays the real scheme of the chemical process, the relationship between the equipment and the technical characteristics of the process. Chemical Process Flow Diagram illustrates the connections between the basic equipment as well as the overall structure of pipelines and other supporting equipment. The purpose of the PFD is to build the image of the basic idea of the chemical process. ConceptDraw PRO together with its Chemical and Process Engineering solution delivers the possibility to design Chemical Process Flow diagrams. It is designed for chemical industry engineers and designers.How to Draw a Bubble Chart
Video tutorials on ConceptDraw products. Try it today!- How to Draw an Organization Chart | Organizational Structure ...
- How to Draw a Bubble Chart | ConceptDraw PRO - Organizational ...
- How to Draw an Organization Chart | Organizational Structure ...
- How to Draw an Organization Chart | Business Diagram Software ...
- Flow Chart Creator | Process Flowchart | ConceptDraw PRO ...
- Organizational Chart Template
- ConceptDraw PRO - Organizational chart software | Organizational ...
- Organizational Structure | Organizational Charts with ConceptDraw ...
- How to Draw an Organization Chart | ConceptDraw PRO ...
- How to Draw an Organization Chart | ConceptDraw PRO ...
- Organizational chart software
- How to Draw an Organization Chart | Pie Chart Examples and ...
- Organizational chart software
- How to Draw an Organization Chart | Gant Chart in Project ...
- ConceptDraw PRO - Organizational chart software | Organizational ...
- ConceptDraw PRO - Organizational chart software | How to Draw an ...
- Business Diagram Software | Org chart - University | Business ...
- Development of software with ConceptDraw PRO | Organizational ...
- How to Draw an Organization Chart | The Best Drawing Program for ...


