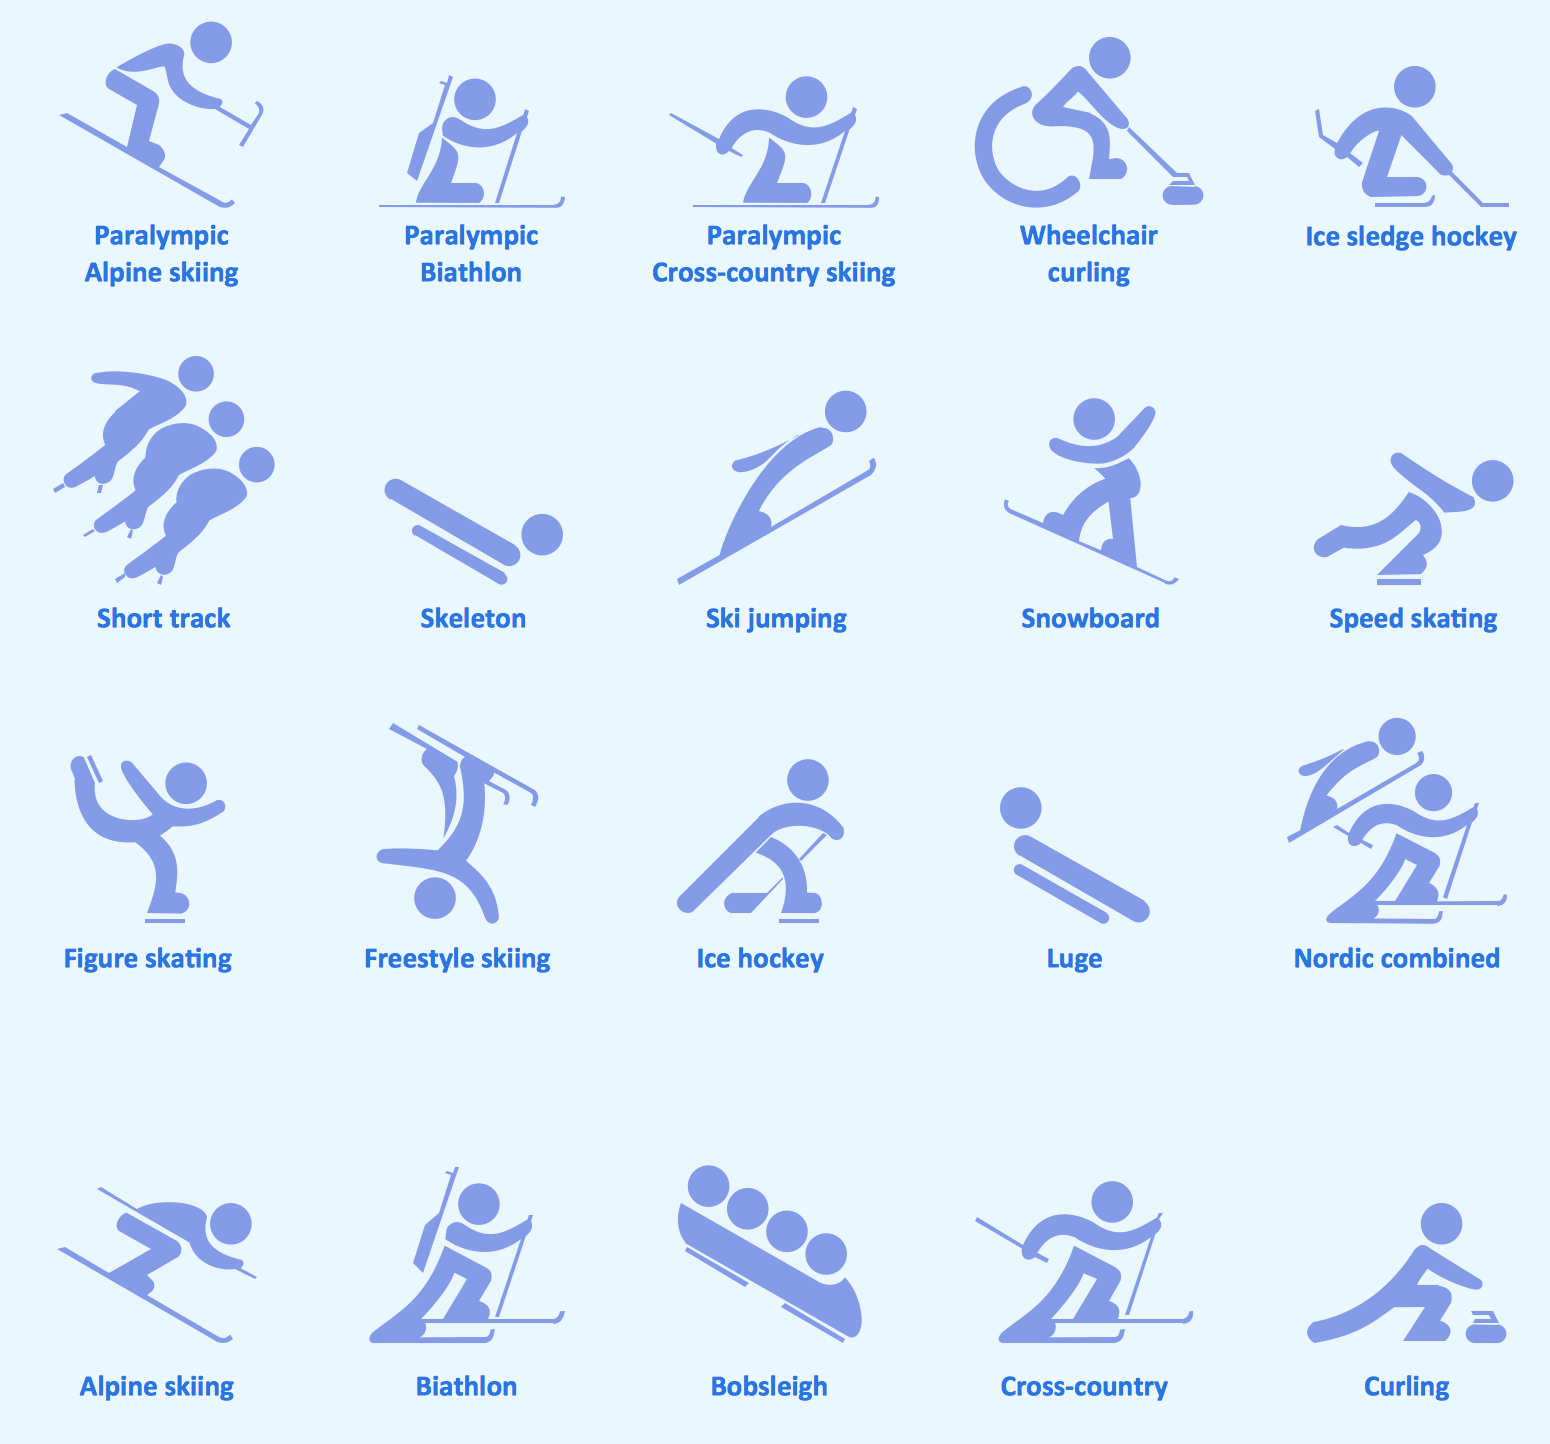
Sport pictograms. Olympic Games
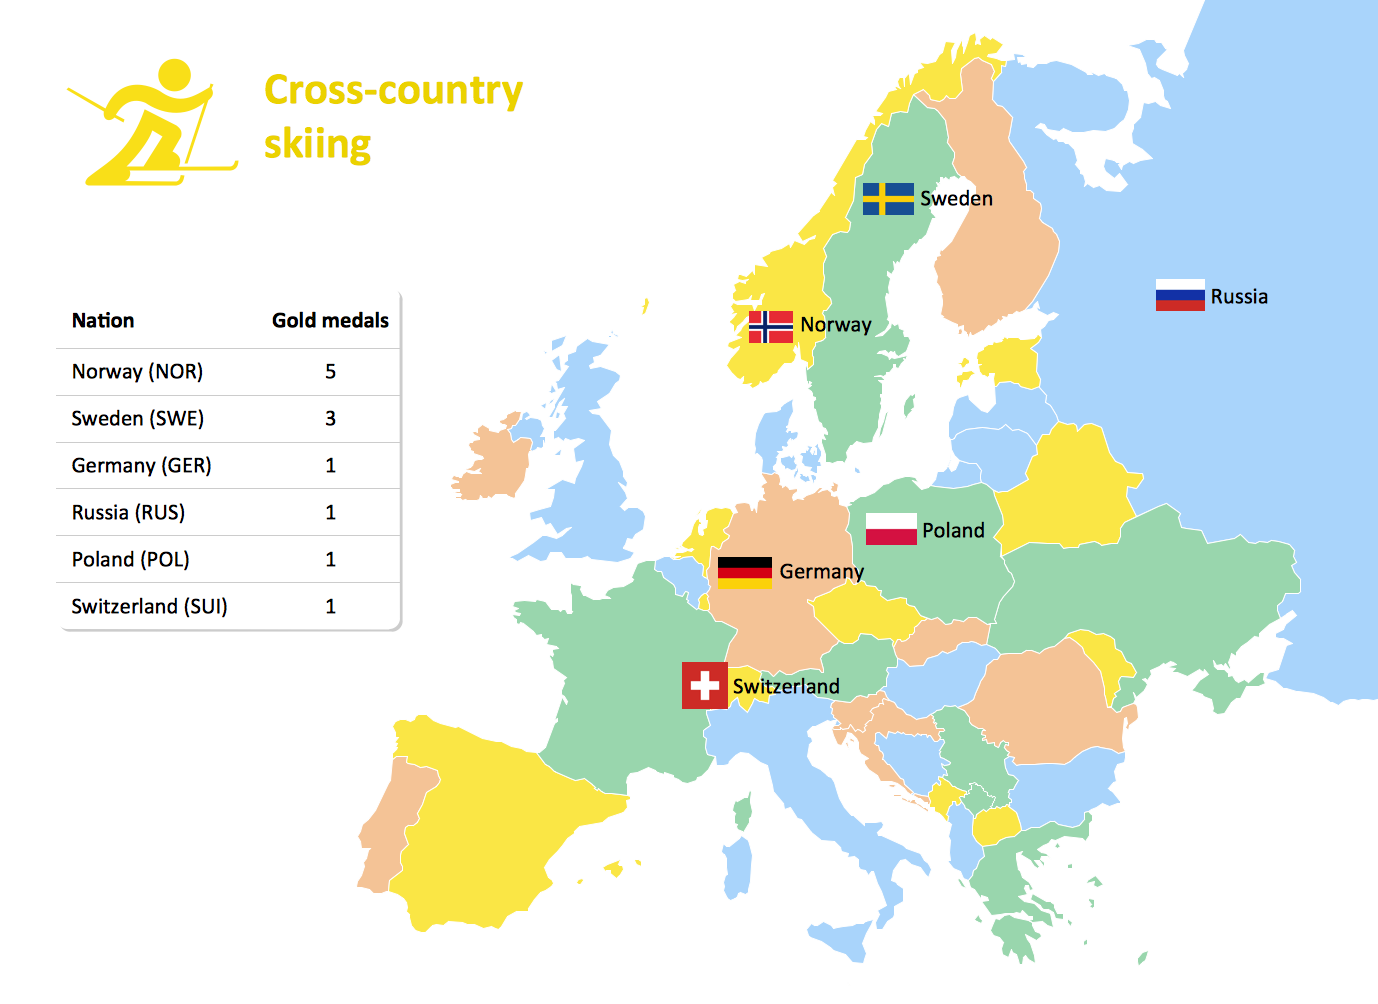
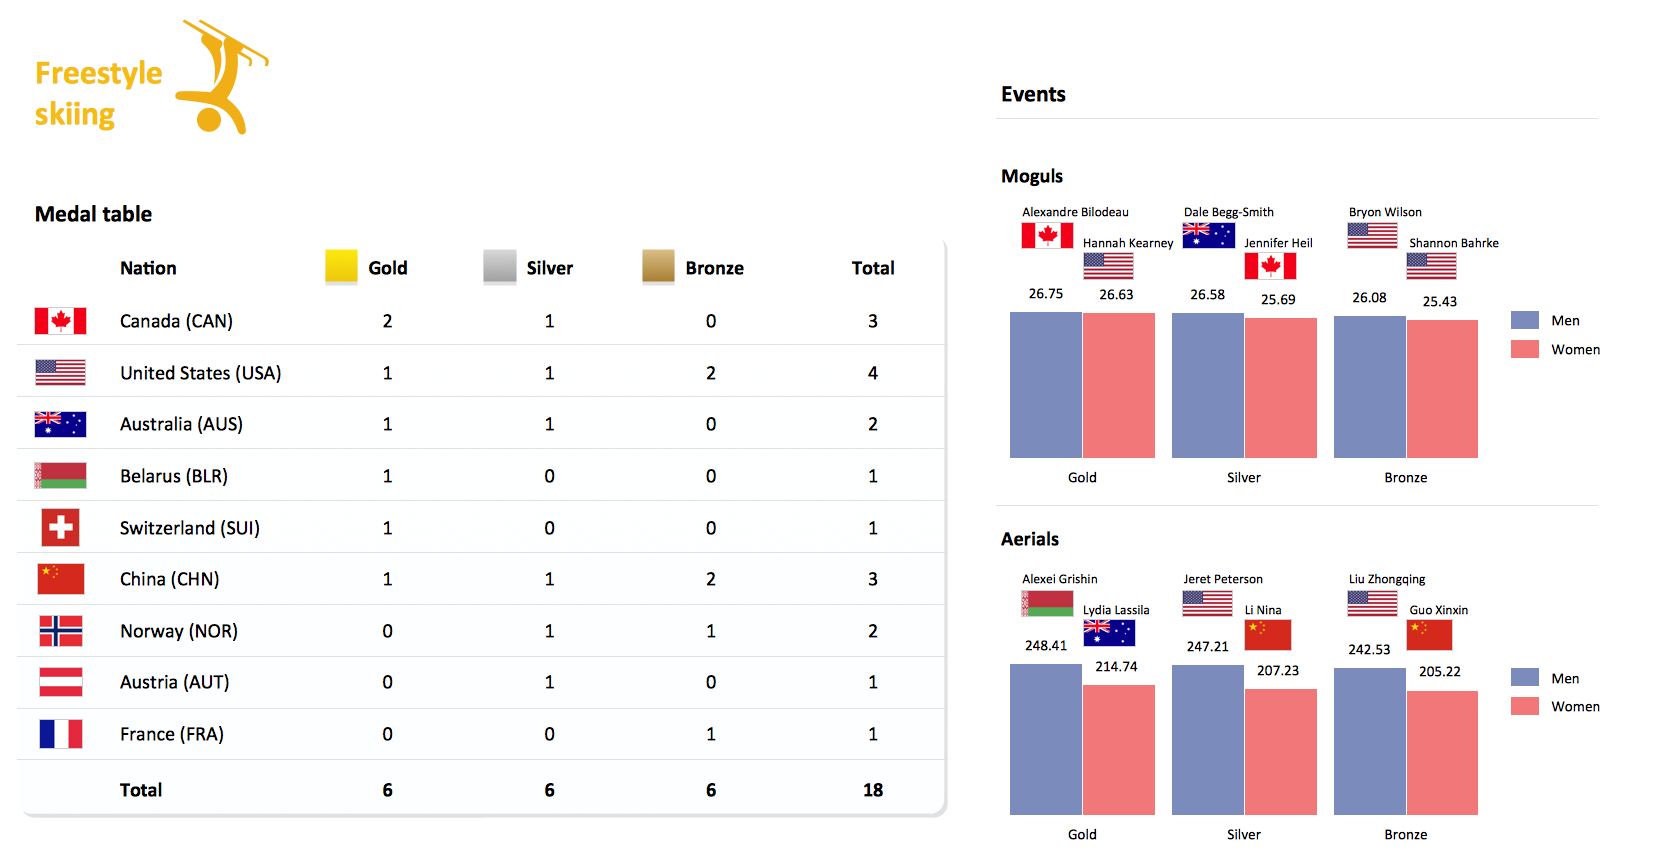
Winter Sports. Olympic Games Infographics. Medal Table
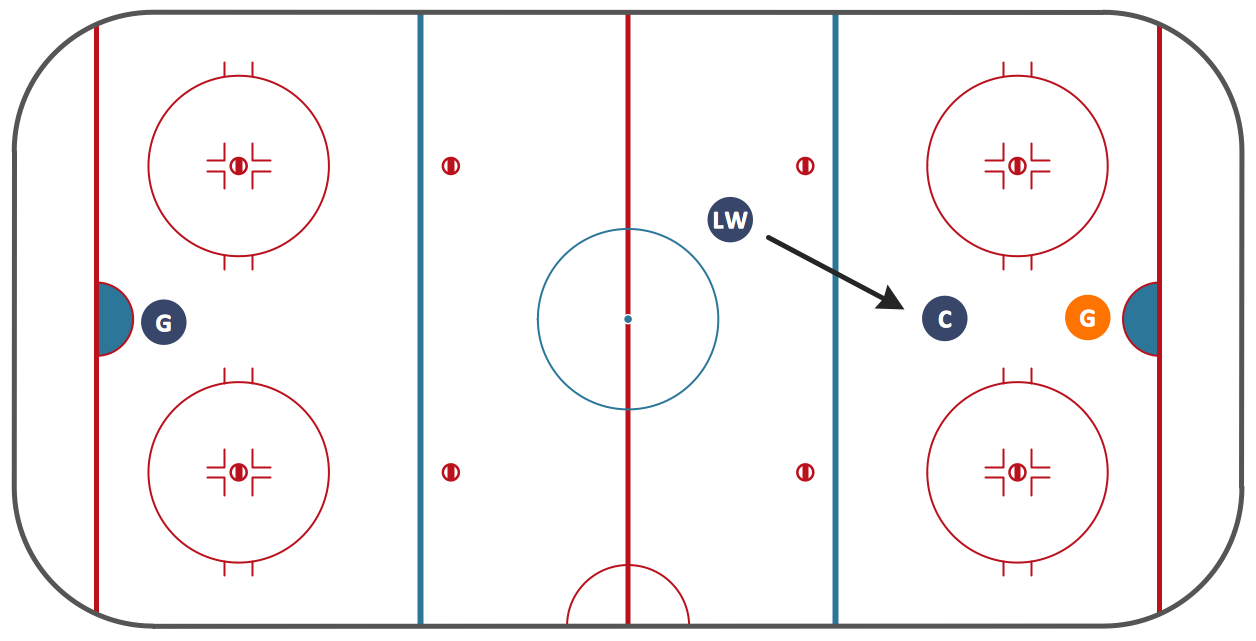
Ice Hockey Offside Diagram
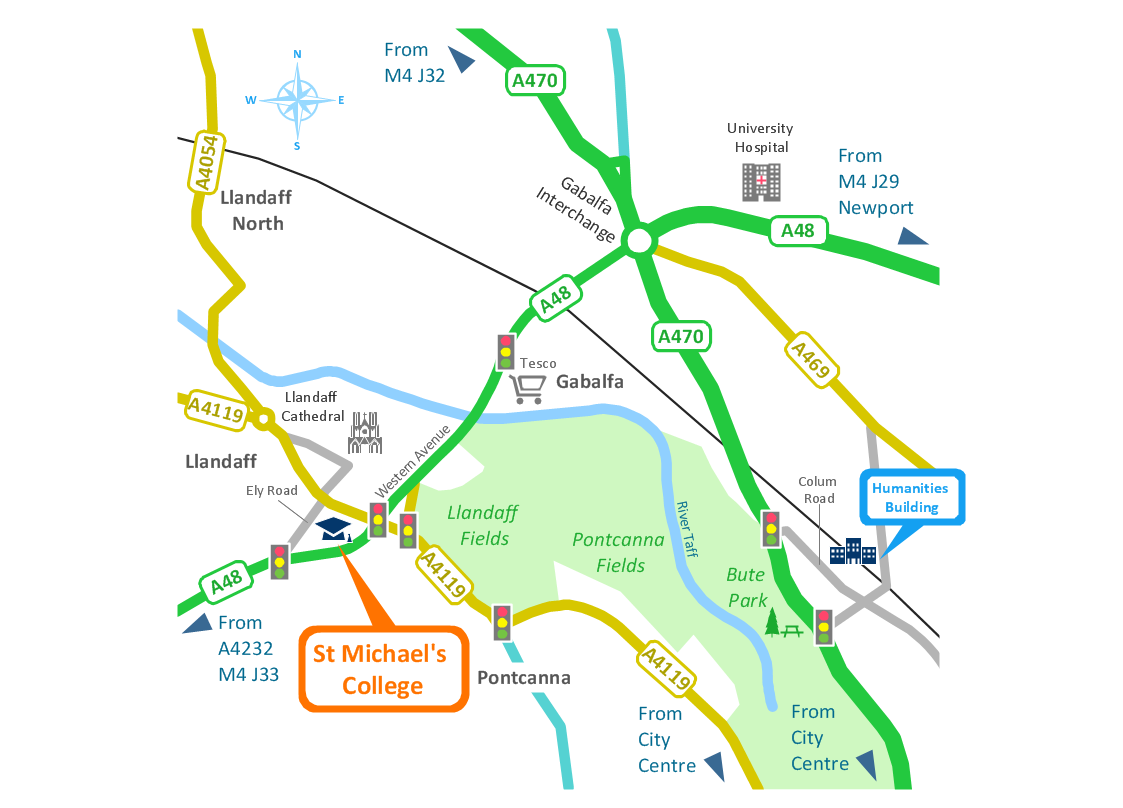
Spatial infographics Design Elements: Transport Map
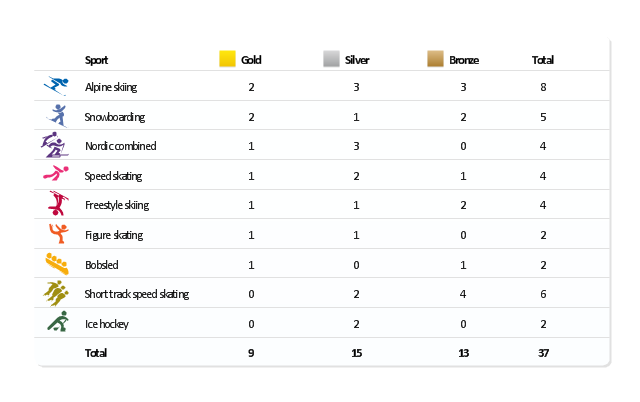
Winter Sports. Olympic Games Illustrations. Medal Summary
 Winter Sports
The Winter Sports solution from Sport area of ConceptDraw Solution Park contains winter sports illustration examples, templates and vector clipart libraries.
Winter Sports Vector Clipart. Medal Map. Spatial Infographics

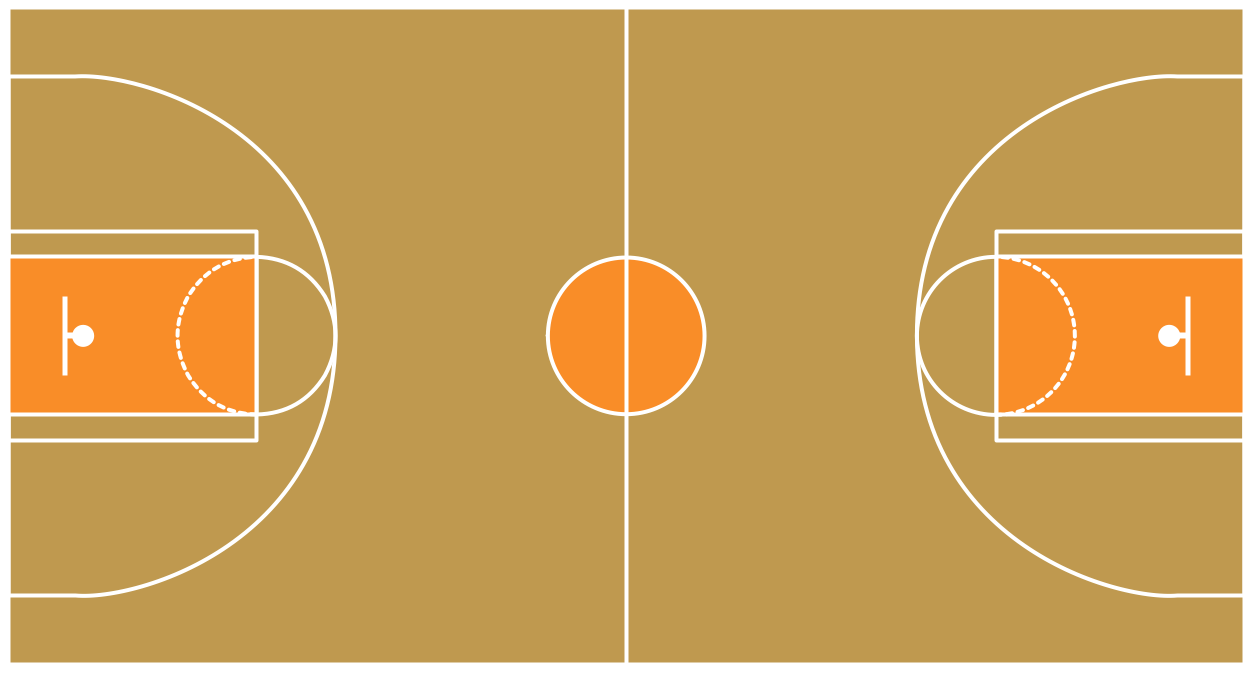
Basketball Illustrations

Basketball Field in the Vector
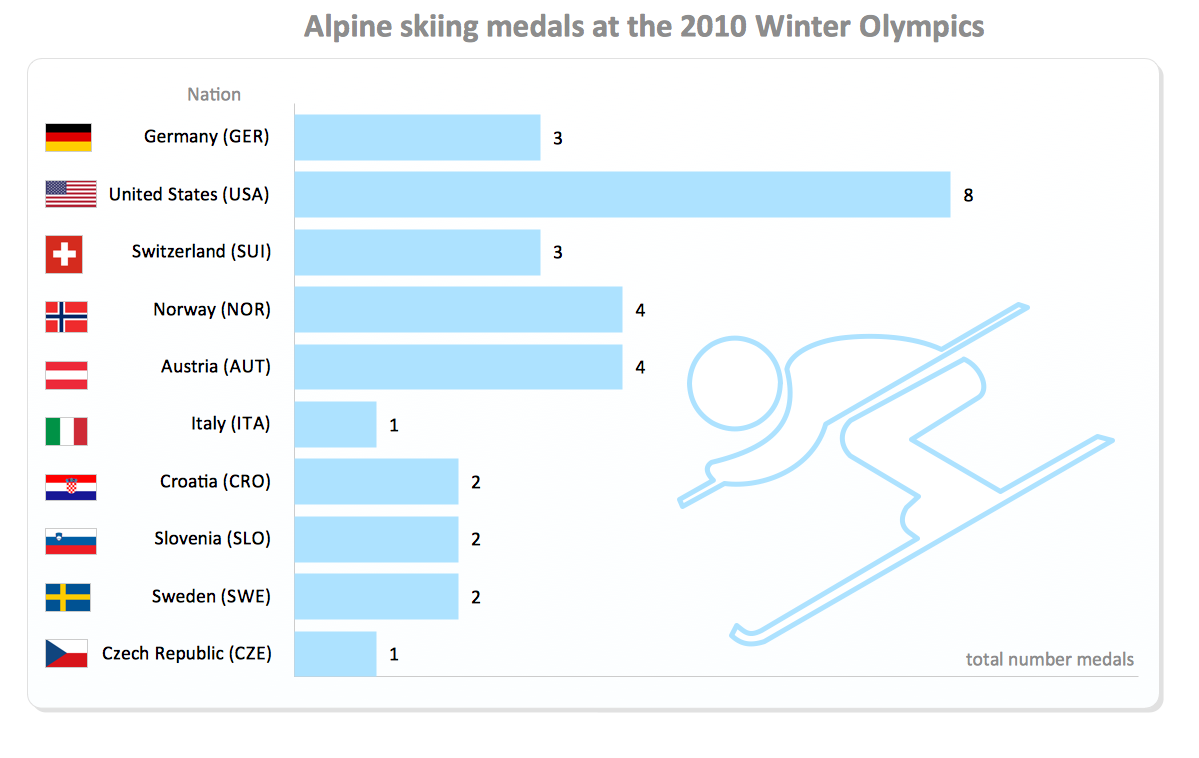
Winter Sports. Illustrations and Visualize Statistics
Design Pictorial Infographics. Design Infographics

Winter Sports. Using Winter Sports Design Elements Producing Infographics

Flowchart

 Area Charts
Area Charts are used to display the cumulative totals over time using numbers or percentages; or to show trends over time among related attributes. The Area Chart is effective when comparing two or more quantities. Each series of data is typically represented with a different color, the use of color transparency in an object’s transparency shows overlapped areas and smaller areas hidden behind larger areas.
"The United States participated in the 2010 Winter Olympics in Vancouver, British Columbia, Canada. The U.S. team had a historic Winter Games, winning an unprecedented 37 medals. Team USA's medal haul, which included nine gold, marked the first time since the 1932 Lake Placid Games that the U.S. earned more medals than any other participant. ...
The United States finished the 2010 Olympic Games by setting a new record for the most medals won by a single country at a Winter Olympics. The previous record of 36 was set by Germany at the 2002 Winter Olympics; with the silver medal won by the men's hockey team in the final Olympic event of 2010, the U.S. earned their 37th medal of the Vancouver Games. In addition, the U.S. team set a Winter Games record for bronze medals with 13, and the 15 silver medals by the U.S. was second only to the record of 16 set by Germany in 2002." [United States at the 2010 Winter Olympics. Wikipedia]
This medal table example "US at the 2010 Winter Olympics" is created using the ConceptDraw PRO diagramming and vector drawing software extended with the Winter Sports solution.
The Winter Sports solution from the Sport area of ConceptDraw Solution Park contains the vector stencils library "Winter sports pictograms" and examples of diagrams and infographics.
Medal table
- Sport pictograms. Olympic Games | Influence Diagram Software ...
- Winter Olympics - Skeleton | Winter Sports | Sport pictograms ...
- Winter Sports | Sport pictograms. Olympic Games | Diagram Of ...
- Winter Sports | Area Charts | Olympic Games Er Diagram Samples
- Winter Sports. Olympic Games Illustrations. Medal Summary ...
- Pyramid Diagram and Pyramid Chart | Sport pictograms. Olympic ...
- Winter Sports. Olympic Games Illustrations. Medal Summary | Sport ...
- Winter Olympics - Luge | Winter Sports | Sport pictograms. Olympic ...
- Network Topologies | Sport pictograms. Olympic Games | PDPC ...
- Winter Olympics - Luge | Winter Sports | Sport pictograms. Olympic ...
- Winter Sports. Olympic Games Infographics. Medal Table | Winter ...
- Sport pictograms. Olympic Games | Winter Olympics pictograms ...
- Winter Sports. Illustrations and Visualize Statistics | Winter Sports ...
- Winter Sports. Illustrations and Visualize Statistics | Winter Sports ...
- Sport pictograms. Olympic Games | Winter Sports. Using Winter ...
- Winter Sports. Olympic Games Infographics. Medal Table | Winter ...
- Winter Sports. Olympic Games Infographics. Medal Table | Winter ...
- Winter Sports. Olympic Games Infographics. Medal Table | Winter ...
- Winter Sports. Using Olympic Games Clipart to Illustrate Tournament ...
- Flow Chart for Olympic Sports | Winter Sports. Olympic Games ...