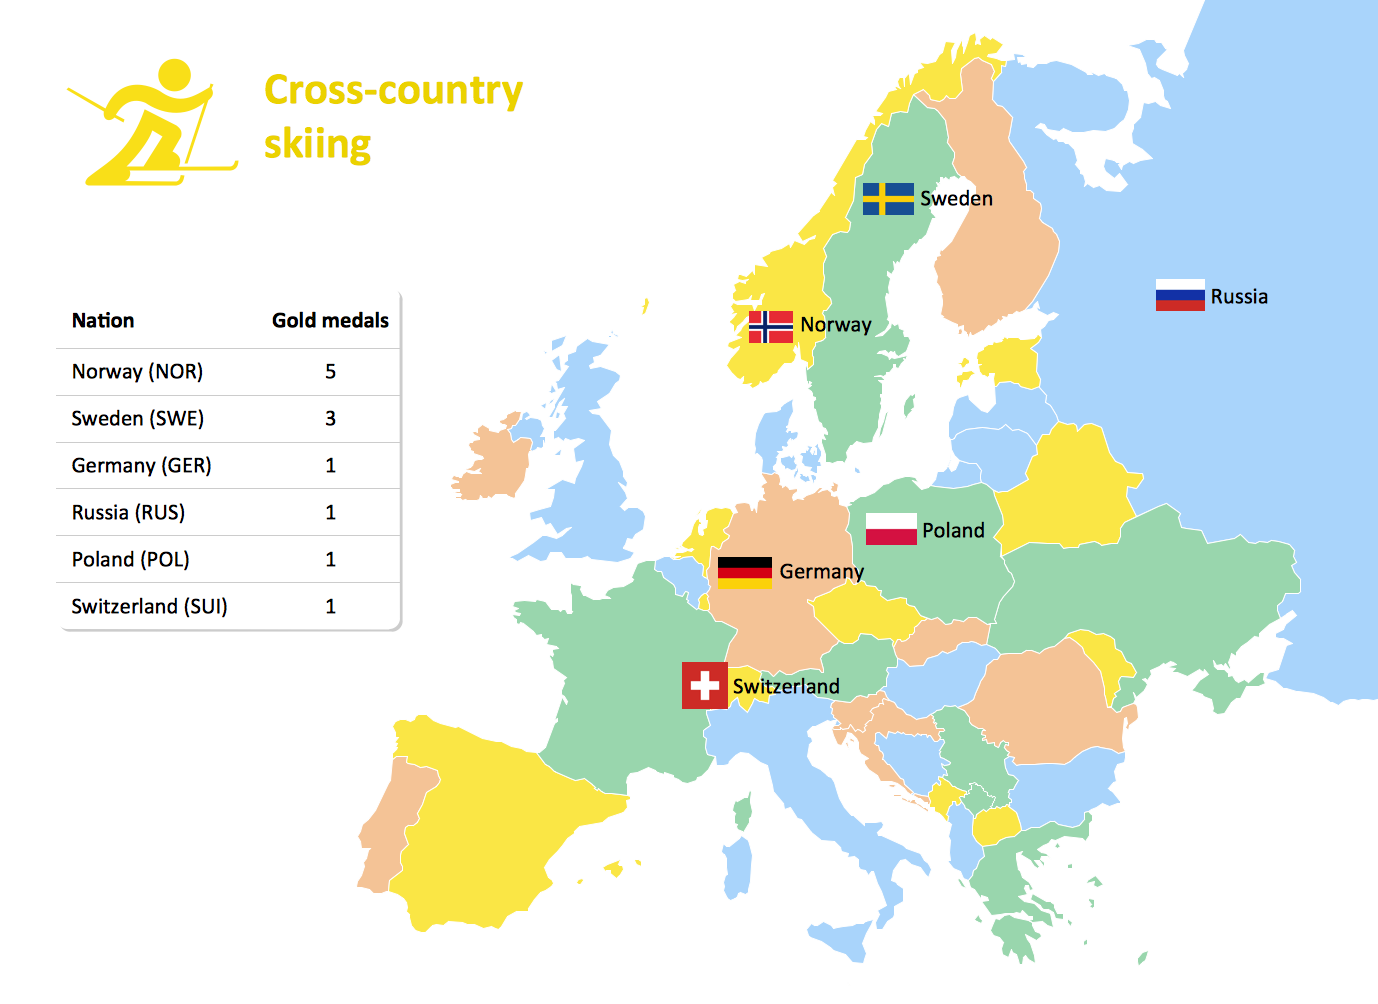
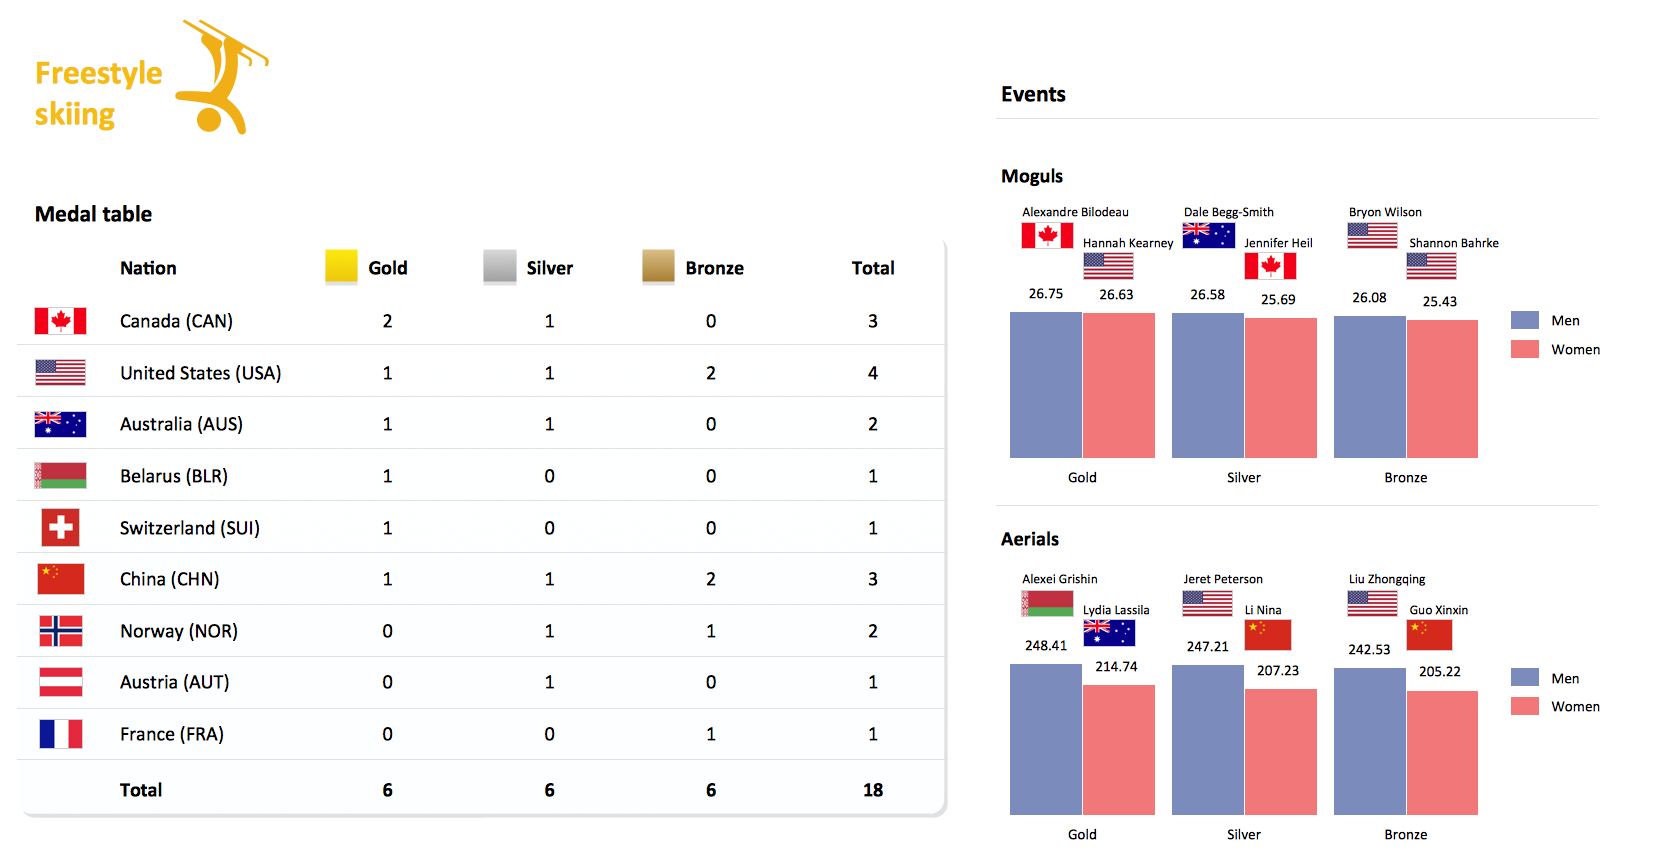
Winter Sports. Olympic Games Infographics. Medal Table
Visualizing data in infographics format is a modern way to represent any statistics related to global sporting events, such as Winter Olympic Games. ConceptDraw PRO software extended with the Winter Sports solution delivers a rich set of samples and templates helps you produce all kind of sporting information, such as tournament schedule or medal table.
 Winter Sports
The Winter Sports solution from Sport area of ConceptDraw Solution Park contains winter sports illustration examples, templates and vector clipart libraries.
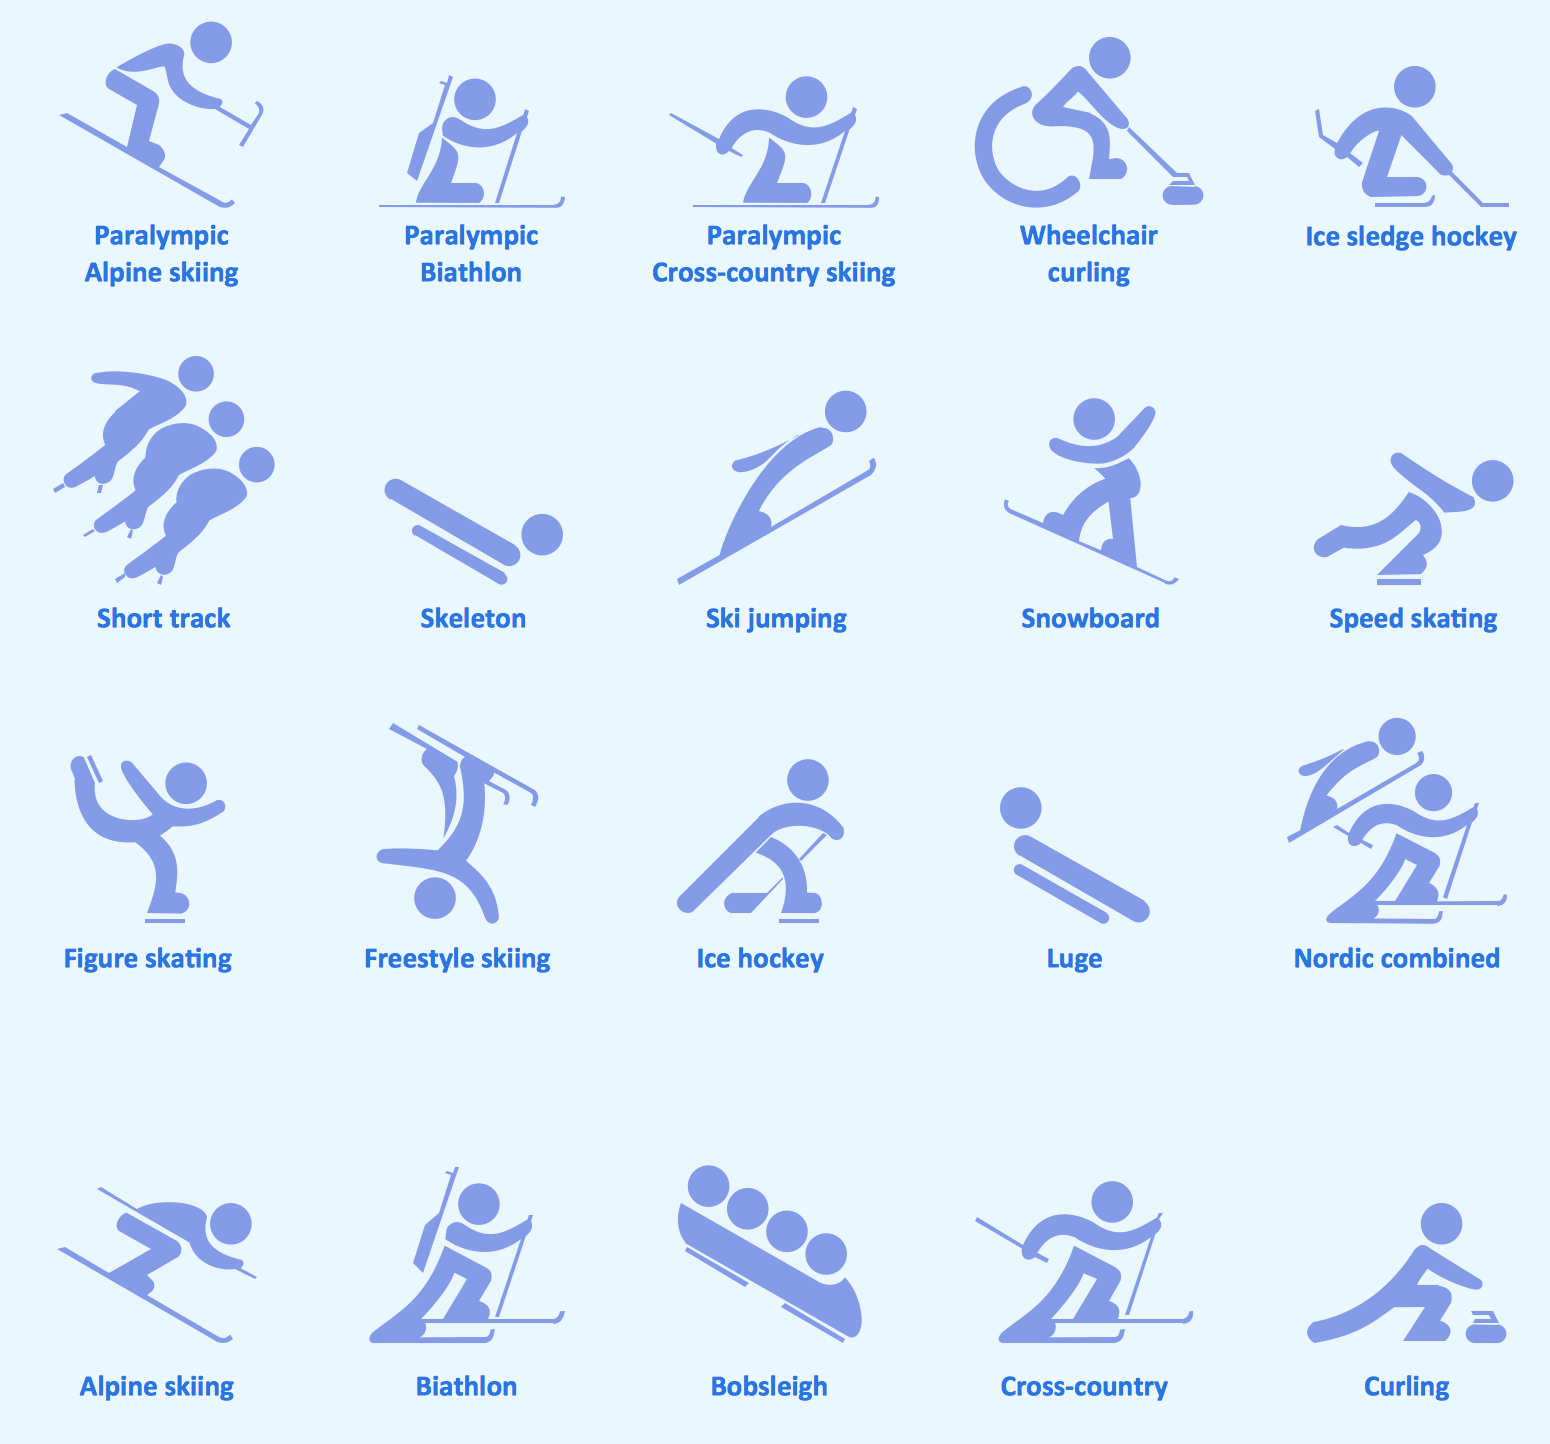
Sport pictograms. Olympic Games
The Winter Sports solution from Sport Area of ConceptDraw Solution Park contains winter sports pictograms you may use illustrating any kind of material about Olympic Games or any other sport competitions.Winter Sports Vector Clipart. Medal Map. Spatial Infographics
Tracking Olympic results in visual format is the most modern way to deliver statistics to a broad audience. This is a good example of an illustrated table you may easily modify, print, or publish on web from ConceptDraw Winter Sports solution .Infographic Software
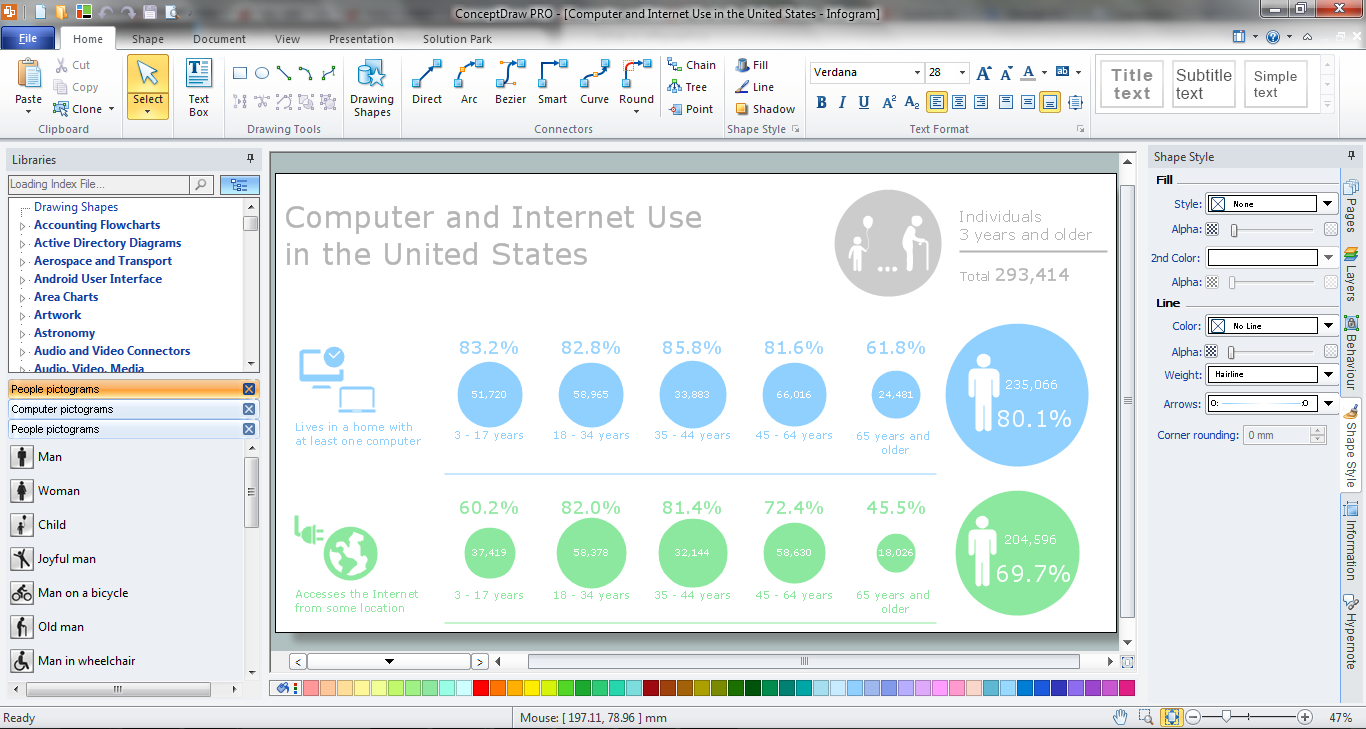
ConceptDraw PRO extended with Pictorial Infographics Solution from the “What are Infographics” Area is a powerful Infographic Software. Make sure in it right now!Soccer (Football) Formation
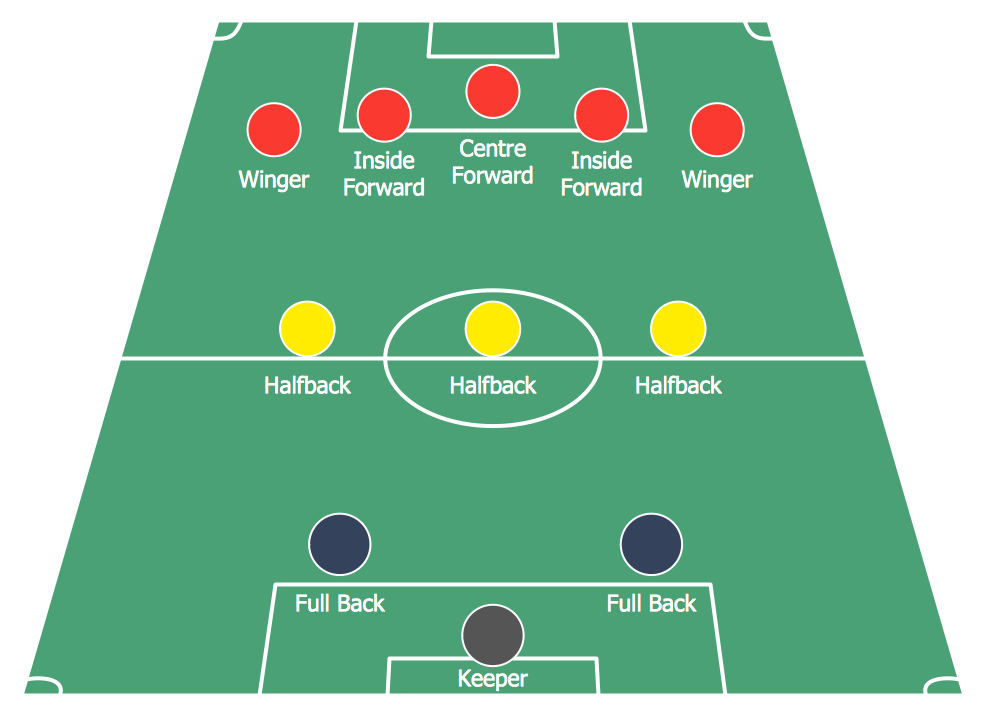
Using diagrams is the easiest way to explain the soccer formations. The Soccer solution from the Sport area of ConceptDraw Solution Park is designed as a tool that helps you produce the soccer diagrams in a few minutes. The predesigned samples of the Soccer solution for ConceptDraw PRO depict the most popular formation diagrams.Winter Sports. Olympic Games Illustrations. Medal Summary
Do you like infographics and data visualization? Creating infographics is super-easy with ConceptDraw.Create Soccer (Football) Positions
Explaining the soccer techniques and rules becomes much more easier and time saving with illustrations. The Soccer solution from the Sport area of ConceptDraw Solution Park provides the libraries, templates and samples that will help you produce the soccer illustrations of any complexity in minutes.Influence Diagram Software
Influence diagram (ID) is a graphical and mathematical representation of the decision. Influence diagrams are widely used in the decision analysis and in the game theory. They are the alternative to the decision tree. The influence diagram gives to analyst the high-level conceptual view that it can use to build the detailed quantitative model.This sample shows the Influence diagram. It is a directed acyclic graph with three types of nodes: Decision node is drawn as a rectangle, Uncertainty node is drawn as an oval, Value node is drawn as an octagon. The nodes are connected with arcs.
Android GUI
Android is an operating system based on the Linux kernel and developed by Google for smartphones, tablet computers, electronic books, netbooks, smartbooks, digital players, watches, game consoles, TV and other devices.ConceptDraw PRO extended with Android User Interface Solution from the Software Development Area is a powerful software with extensive drawing tools which can help you to build the intelligible, attractive and easy for perception Android GUI for your application.
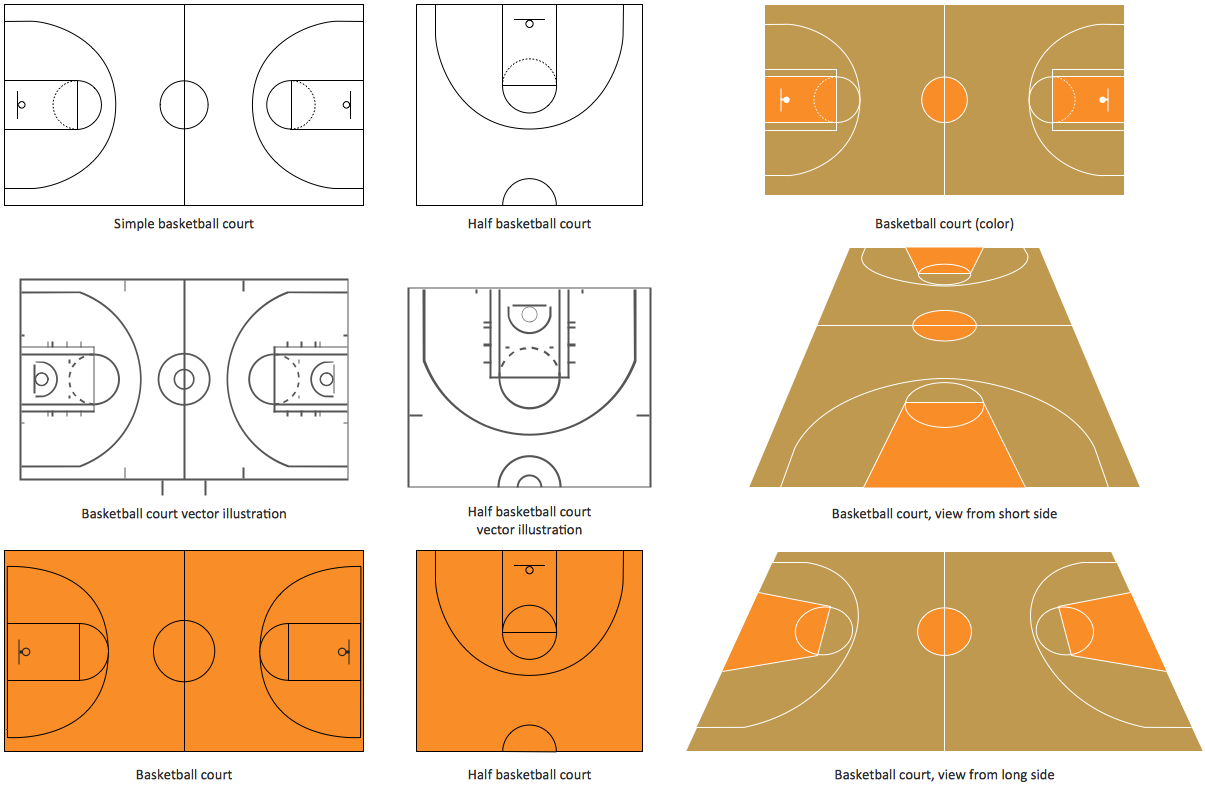
Basketball Court Diagram and Basketball Positions
ConceptDraw PRO software extended with the Basketball solution from the Sport area of ConceptDraw Solution Park provides libraries, templates and samples allowing basketball specialists and fans to draw the professional looking diagrams and schemas of any complexity in a few minutes. It’s very convenient way to explain the different basketball tactics, positions and rules using the visual illustrations.Bar Diagrams for Problem Solving. Create event management bar charts with Bar Graphs Solution
Create bar charts for event management problem solving and visual data comparison using the ConceptDraw PRO diagramming and vector drawing software extended with the Bar Graphs Solution from the Graphs and Charts area of ConceptDraw Solition Park.Basketball Field in the Vector
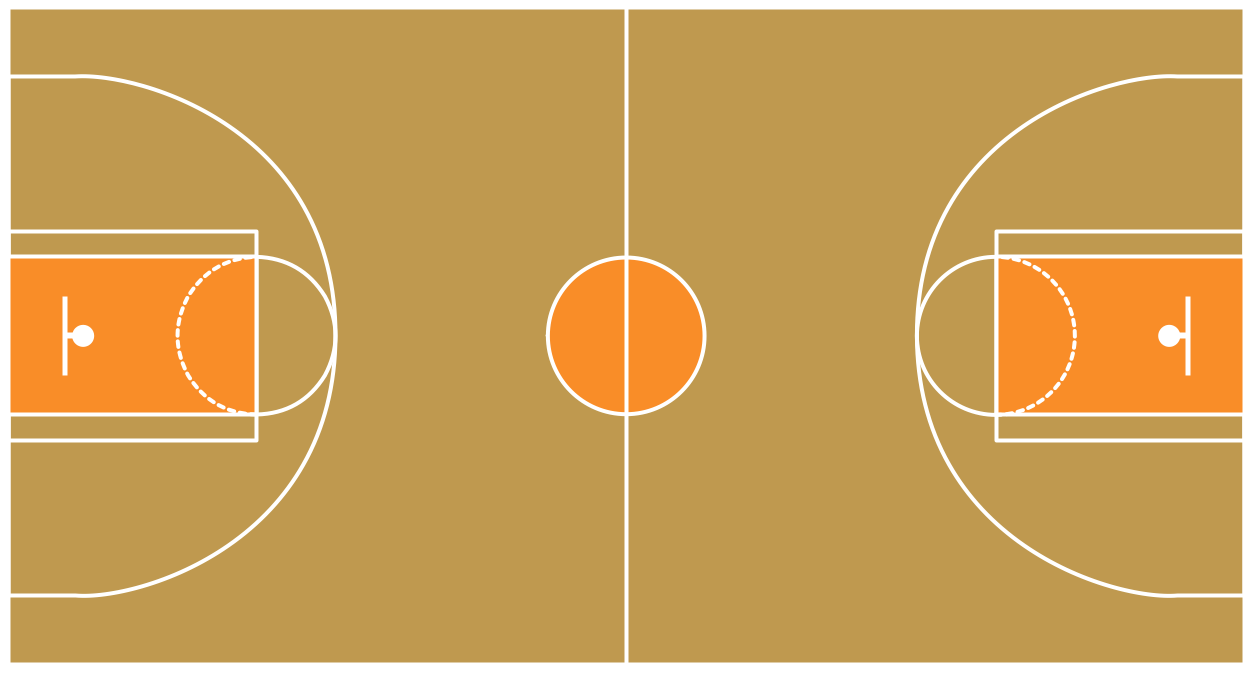
The Basketball Field library from the Basketball solution provides a complete set of ready-to-use predesigned vector courts: horizontally and vertically located, whole and half of court, colored and not, courts with views from different sides.All courts objects are designed according to the real basketball courts dimensions. Simply drop the needed basketball field in the vector from the library to design your own basketball diagram.
Influence Diagram
This sample shows the Influence Diagram. It was created in ConceptDraw PRO diagramming and vector drawing software using the Basic Diagramming Solution from the Universal Diagramming area of ConceptDraw Solution Park.Influence diagram represents the directed acyclic graph with three types of nodes and three types of arcs that connect the nodes. Decision node is drawn as a rectangle, Uncertainty node is drawn as an oval, Value node is drawn as an octagon.
- Specification and Description Language (SDL) | Football | Mind Map ...
- Soccer | 2014 FIFA World Cup | Soccer (Football) Tactics | Soccer ...
- Winter Sports Vector Clipart. Medal Map . Spatial Infographics ...
- Winter Sports | Winter Sports Vector Clipart. Medal Map . Spatial ...
- Sport pictograms. Olympic Games | Winter Sports Vector Clipart ...
- Winter Sports | Design elements - Winter sports pictograms | Winter ...
- World Tourism Infographic
- Football | Soccer | 2014 FIFA World Cup | Football Map Of Positions
- Speed skating - Winter sports pictograms | Figure skating - Winter ...
- Positioning map
- World Map
- Geo Map - United States of America Map | Geo Map - Canada ...
- How to Connect Social Media DFD Flowchart with Action Maps ...
- Winter Sports Vector Clipart. Medal Map . Spatial Infographics ...
- Map Of A Soccer Field
- Gold Medals in 2010 Winter Olympics - Infographics with winter ...
- Football | Soccer | Create Soccer (Football) Positions | Map Of ...
- Sochi 2014 Olympics - Men's hockey tournament schedule ...
- Winter Sports | Winter Sports Vector Clipart. Medal Map . Spatial ...
- How To use Landscape Design Software | Sketching Software ...
