This site uses cookies. By continuing to browse the ConceptDraw site you are agreeing to our Use of Site Cookies.
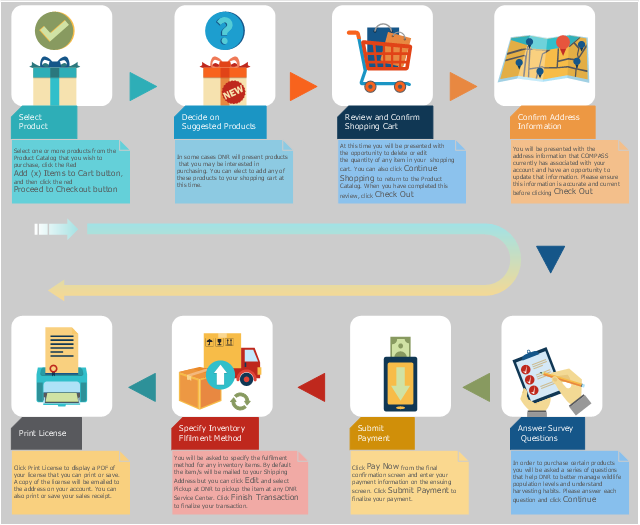
This example was created on the base of the hunting and fishing license sales flowchart from the COMPASS portal of the Department of Natural Resources, Maryland, U.S.
[compass.dnr.maryland.gov/ Help/ Topic/ ViewTopic/ ExecutingaSalesTransaction]
The COMPASS portal "allow you quick and easy access to hunting and fishing licenses, regulations and other important information about outdoor recreation in Maryland." [compass.dnr.maryland.gov/ DnrCompassPortal]
The example "Hunting and fishing license sales flowchart" was created using the ConceptDraw PRO diagramming and vector drawing software extended with the Sales Flowcharts solution from the Marketing area of ConceptDraw Solution Park.
Sales flowchart
Sales flowchart, vertical moving arrow, u shaped arrow, triangle arrow, sales orders, question, product, page, online payment, new products, invoice, full shopping cart, exporting, empty shopping cart, double arc arrow, distribution, copy center, checkbox, card,

UK Map

The United Kingdom of Great Britain and Northern Ireland, commonly known as the United Kingdom (UK), is a sovereign state in Europe which consists of four countries: England, Scotland, Wales, and Northern Ireland. UK is surrounded by the waters of Atlantic ocean, the North Sea, the English Channel, and the Irish Sea and includes large number of big and small islands. ConceptDraw DIAGRAM diagramming and vector drawing software offers the unique Map of UK Solution from the Maps Area of ConceptDraw Solution Park that is indispensable for easy drawing professional looking map of UK, UK counties map, UK map with cities, map of Scotland, map of England, map of Wales, Northern Ireland map.

Flowcharts

We have a lot of samples of flowchart diagrams for your needs.

logistics flow charts, logistics planning, logistics and supply chain, logistics management software, inventory flow chart Logistics Flow Charts

logistics flow charts, logistics planning, logistics and supply chain, logistics management software, inventory flow chart
Logistics Flow Charts solution extends ConceptDraw DIAGRAM functionality with opportunities of powerful logistics management software. It provides large collection of predesigned vector logistic symbols, pictograms, objects and clipart to help you design with pleasure Logistics flow chart, Logistics process flow diagram, Inventory flow chart, Warehouse flowchart, Warehouse management flow chart, Inventory control flowchart, or any other Logistics diagram. Use this solution for logistics planning, to reflect logistics activities and processes of an enterprise or firm, to depict the company's supply chains, to demonstrate the ways of enhancing the economic stability on the market, to realize logistics reforms and effective products' promotion.

sales process map, sales process flowchart, sales steps, sales process management Sales Flowcharts

sales process map, sales process flowchart, sales steps, sales process management
The Sales Flowcharts solution lets you create and display sales process maps, sales process workflows, sales steps, the sales process, and anything else involving sales process management.

manufacturing drawings Manufacturing and Maintenance

manufacturing drawings
Manufacturing and maintenance solution extends ConceptDraw DIAGRAM software with illustration samples, templates and vector stencils libraries with clip art of packaging systems, industrial vehicles, tools, resources and energy.

Residential Electric Plan

How to create a Residential Electric Plan quick and easy? The simplest way is to use the tools of ConceptDraw DIAGRAM software extended with Electric and Telecom Plans Solution from the Building Plans Area of ConceptDraw Solution Park.

Landscape Architecture with ConceptDraw DIAGRAM

The landscape architecture includes landscape design, planning, and realization, as well as management of resources and buildings. The smaller scale landscape projects are well known as landscape design and garden design. The landscape design documentation is created independently from the project's scale and includes sketches, general plan and working documentation. On this stage the ConceptDraw DIAGRAM software extended with Landscape & Garden solution is irreplaceable assistant for you. The landscape designs created using ConceptDraw DIAGRAM are effectively used by landscape architects and engineers, also by landscape managers who maintain parks, gardens, natural landscapes like woodlands or nature reserves, and artificial landscapes. The Landscape and Garden solution contains 14 libraries with a lot of vector graphics objects of trees, flowers, bushes, fountains, ponds, furniture, roofs, patios, fences, garden accessories, entertainment, roads, junctions, etc., that are suitable for any gardener to simply design a wonderful garden.

Flow Map

A Flow Map is a type of thinking maps which help easy organize and understand information. It consists of the set of boxes and arrows, and visually displays a sequence of events. ConceptDraw DIAGRAM diagramming and vector drawing software extended with Flowcharts Solution from the "Diagrams" Area of ConceptDraw Solution Park allows you to draw in a few minutes the Flow Map of any degree of complexity.

Process Flow Chart Symbol

Process Flow Charts are very popular and widely used in chemical and process engineering for representation a general flow of plant processes and equipment. If you need often draw them, the ConceptDraw DIAGRAM diagramming and vector drawing software extended with tools of Flowcharts Solution will be useful for you. The mostly used set of process flow chart symbols includes the following: Rectangle (box) process flow chart symbol, Rounded rectangle, Circle, Diamond.

cross-functional flowchart template, flowchart, example business process flow Cross-Functional Flowcharts

cross-functional flowchart template, flowchart, example business process flow
The Cross-Functional Flowcharts solution extends ConceptDraw DIAGRAM software with cross functional flowchart examples, samples, and libraries of cross functional flow chart vector design elements and CH-1 symbols for easy drawing professional-looking and illustrative Cross Functional Flowchart, Cross Functional Diagram, CH-1 Diagram, Process Flowchart, Deployment Flowchart, Opportunity Flowchart, Swimlane Process Mapping Diagram, or Visio Cross Functional Flowchart for planning and further analyzing, optimizing and improvement processes. The use of included pre-made cross functional flowchart template, opportunity flowchart template, and swimlane process map template, greatly easier designing your Cross-functional flowcharts.

Workflow Diagram Template

Starting producing workflow diagram from template you save time and avoid the blank page syndrome. At first, the workflow template is set of rules for a workflow. The workflow symbols used in the specific case are part of workflow template. This is the subset of large standard collections of workflow symbols. The first part of workflow template is identification of symbols allowed in use in your specific case. The best way would be to collect them in your customized drawing collection of workflow symbols which used in your specific cases of workflow diagrams. Another way to create business process documents is using business process flow diagram which have similar purposes and have different visual notation. ConceptDraw DIAGRAM is professional workflow diagram software with the rich extentions from ConceptDraw Solution Park. The basic solution for workflow diagramming is Workflow Diagrams Solution. It delivers a rich set of workflow diagram templates and samples help you draw diagrams e

IDEF0 standard with ConceptDraw DIAGRAM

The activity of any organization is more or less branchy network of processes. The description of these processes is a hard technical task which requires definite methodology and standards. According to the IDEF0 standard any process can be described in the form of a block (Activity Box) which has inputs and outputs. The process consists in transformation of inputs into outputs under the influence of the management and in the presence of necessary resources. Outputs of the given process later on can be either inputs for the next process or resources, or management means.

Venn Diagram

Venn diagrams are illustrations used in the branch of mathematics known as set theory. They show the mathematical or logical relationship between different groups of things (sets). A Venn diagram shows all the possible logical relations between the sets.

bubble diagram, circle-spoke diagram, marketing diagrams, circular arrows diagrams, segmented cycle diagram, Venn diagram, draw logical relations Business Diagrams

bubble diagram, circle-spoke diagram, marketing diagrams, circular arrows diagrams, segmented cycle diagram, Venn diagram, draw logical relations
The Business Diagrams Solution extends ConceptDraw DIAGRAM with an extensive collection of professionally designed illustrative samples and a wide variety of vector stencils libraries, which are the real help for all business-related people, business analysts, business managers, business advisers, marketing experts, PR managers, knowledge workers, scientists, and other stakeholders allowing them to design the bright, neat, expressive and attractive Bubble Diagrams, Circle-Spoke Diagrams, Circular Arrows Diagrams, and Venn Diagrams with different quantity of sets in just minutes; and then successfully use them in documents, reports, statistical summaries, and presentations of any style.

Meeting Agenda Map

The high-quality preparation for a meeting is the key to its successful holding. First of all, the meeting preparation includes the definition of the meeting objectives, making the list of participants, setting the time, and obligatory thorough thinking of the list of issues for consideration. ConceptDraw MINDMAP software and PM Meetings solution make the meeting preparation a quick and simple task, and as result contribute the more efficient holding of the meetings. They allow easily outline ideas during the meeting, record the meeting results and share them, organize the team brainstorming and record brainstorming results, track meeting agendas and collaboratively edit them. All collaborative decisions made by the project team during the meeting are captured together as part of the meeting process, and then are distributed. This method lets to make your meetings more productive and keeps the company's activities in correct direction. ConceptDraw MINDMAP lets you easier the preparation of regular meetings thanks to the use of templates and helps transform the boring meetings into creative and productive work of the entire team.

Chemical Flow Chart

Comprehensible illustration of current workflows provides the possibilities of monitoring and analysis processes in order to improve them and increase the potential of used resources. ConceptDraw DIAGRAM with Chemical and Process Engineering solution included is useful for chemical engineers, process engineers, performance and compliance consultants to create Chemical Flow Chart fast and easy. Design your chemical flow charts efficiently and identify the most reliable and safe solutions to ensure your enterprise's integrity and make it future-proof.

Flowchart of Products
Flowchart Examples

This sample shows the Flowchart of the Sustainment and Disposal. A Flowchart is a graphically representation of the process that step-by-step lead to the solution the problem. The geometric figures on the Flowchart represent the steps of the process and are connected with arrows that show the sequence of the actions. The Flowcharts are widely used in engineering, architecture, science, analytics, government, politics, business, marketing, manufacturing, administration, etc.

Contoh Flowchart

The Flowcharts are graphical representations of algorithms, processes or step-by-step solutions problems. There are many different types of Flowcharts, among them Process Flowchart, Cross Functional Flowchart, Data Flow Diagram, IDEF Flowchart, Workflow Diagram, Contoh Flowchart and many others. They have especial value when you need represent a complex process, depict in details the process of solution problems, efficiently plan and set the tasks priorities. The Flowcharts must to be constructed brief, clear and logical, simplifying the process or procedure, and making easier the comprehension and perception of information. The ConceptDraw DIAGRAM software makes the process of creating the flowcharts of any types well organized and clear for developers and customers also, including the Contoh Flowchart. It is possible due to the Flowcharts solution from ConceptDraw Solution Park, its predesigned vector objects, templates, and a lot of professional-looking practical samples and examples which can be quick and easy modified, printed, or published on web.

decision maker, analytic hierarchy process (ahp), t chart, decision matrix, decision tree analysis Decision Making

decision maker, analytic hierarchy process (ahp), t chart, decision matrix, decision tree analysis
The Decision Making solution offers the set of professionally developed examples, powerful drawing tools and a wide range of libraries with specific ready-made vector decision icons, decision pictograms, decision flowchart elements, decision tree icons, decision signs arrows, and callouts, allowing the decision maker (even without drawing and design skills) to easily construct Decision diagrams, Business decision maps, Decision flowcharts, Decision trees, Decision matrix, T Chart, Influence diagrams, which are powerful in questions of decision making, holding decision tree analysis and Analytic Hierarchy Process (AHP), visual decomposition the decision problem into hierarchy of easily comprehensible sub-problems and solving them without any efforts.