Chemical Flow Chart
The chemical industry is a large industry of an international scale, which includes a lot of processes. The main goal for the management and chemical engineers is to ensure the sustainability and efficient development of the enterprise. A visual representation of all the steps of a particular process and relationships between them, decisions, and tasks associated with a process is useful for taking decisions at the enterprise efficiently. Chemical flow charts and Process flow diagrams (PFDs) or flowsheets are the most used types of flow charts to illustrate high-level chemical processes.
Chemical flow chart is a graphical representation of the processes in chemical engineering. It shows the major equipment, how different parts of the process are interconnected, and step-by-step path of the process flow, typically from the top down.
Chemical flow charts can show the work of a whole system or its separate parts. They provide a better understanding of the process, repeatable tasks, biochemical reactions, the types of used equipment and utility supplies, chemicals and raw materials, the operating conditions, and principles of operation of the equipment to run a technological process.
Chemical flow charts is a way to standardize your processes. They make conditions for efficient quality control at the industrial enterprise. It is also an effective training and safety tool, a way to track compliance to normatives and correspondence to changes on the market. However, one of the most important points is keeping your diagram up to date. Only in this case, it will be efficient.
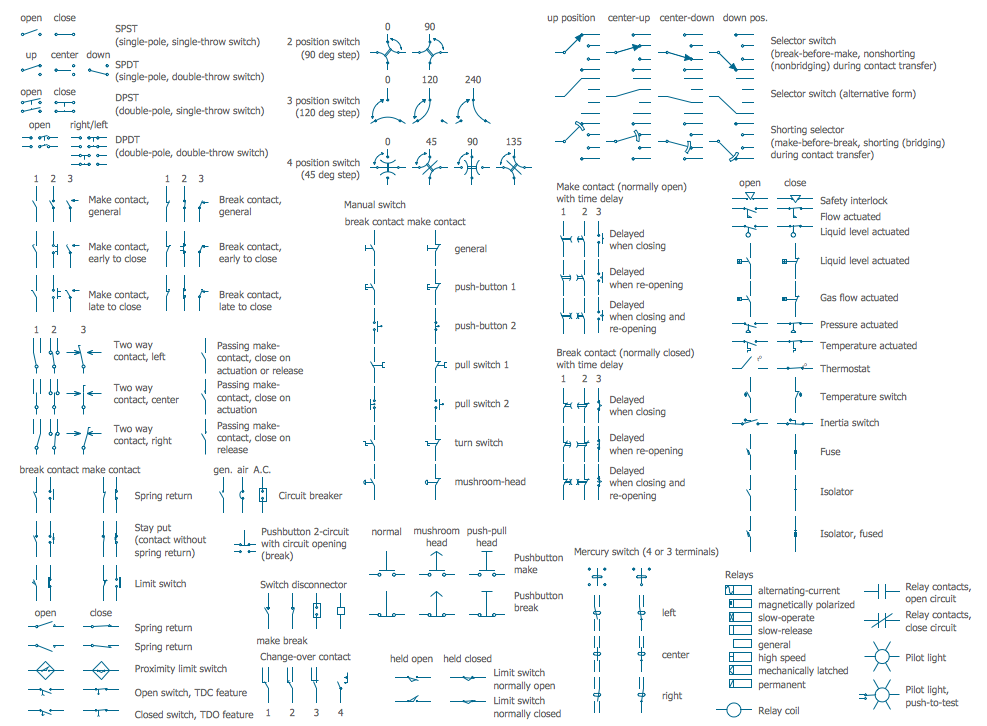
A wide variety of shapes and flow elements are used to visually represent workflows. Each icon is applied to show a specific component of a process. Rectangles, ovals, diamonds, and circles are the most used shapes for flow charts. The connection lines and arrows also vary according to the kind of provided signal. For example, process lines and signal lines have different thicknesses.
Just a few shapes are enough for simple processes, while detailed flow charts require a large number of components and include complex connections. At the same time, the illustration through workflow diagrams has a special advantage exactly for companies operating with complex processes.
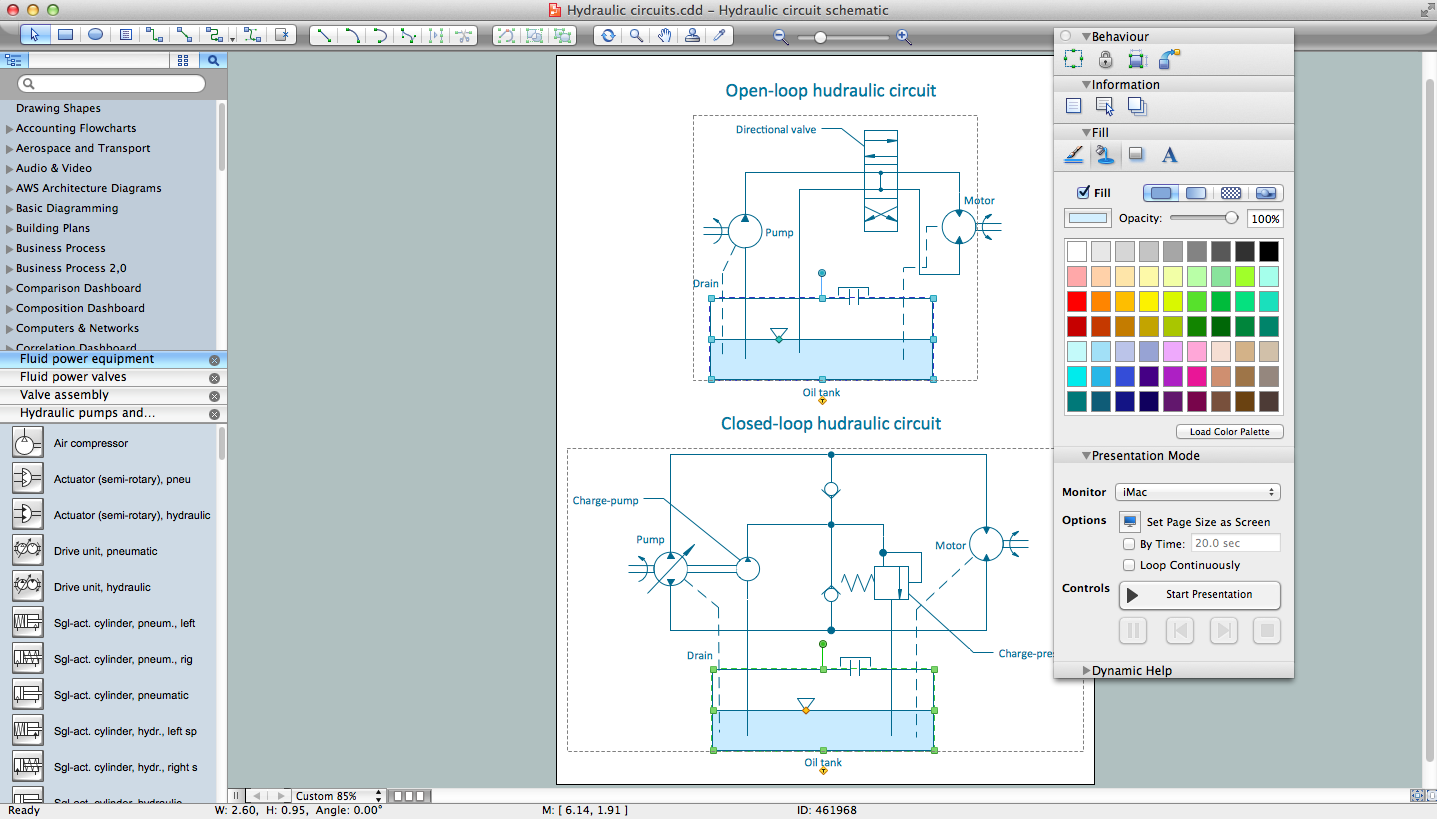
Example 1. Chemical Flow Chart in ConceptDraw DIAGRAM Software
Usually, the diagram illustrating multiple unit processes at an enterprise contains less detail and provides only a general overview of processes and properties. The visual representation of the process steps helps to operate large amounts of information, easier understanding of connections and relations between them, simplifies analysis and identification of mistakes and imperfections in the process flow.
ConceptDraw DIAGRAM with Chemical and Process Engineering solution included is useful for chemical engineers, process engineers, performance and compliance consultants to create Chemical Flow Chart fast and easy. It includes chemical symbols, elements used in PFDs, and a lot of examples. The included vector design elements — industrial equipment, chemical and process engineering equipment, instruments, valves, pumps, vessels, and many more vector symbols correspond to ISO and ANSI standards, this ensures a common understanding of the diagrams by any stakeholders.

Comprehensible illustration of current workflows provides the possibilities of monitoring and analysis processes in order to improve them and increase the potential of used resources. Design your chemical flow charts efficiently and identify the most reliable and safe solutions, which are able to ensure your enterprise's integrity and make it future-proof. Develop ways to achieve steady-state operation and equilibrium and evaluate the extensive advantages of using flowcharts.

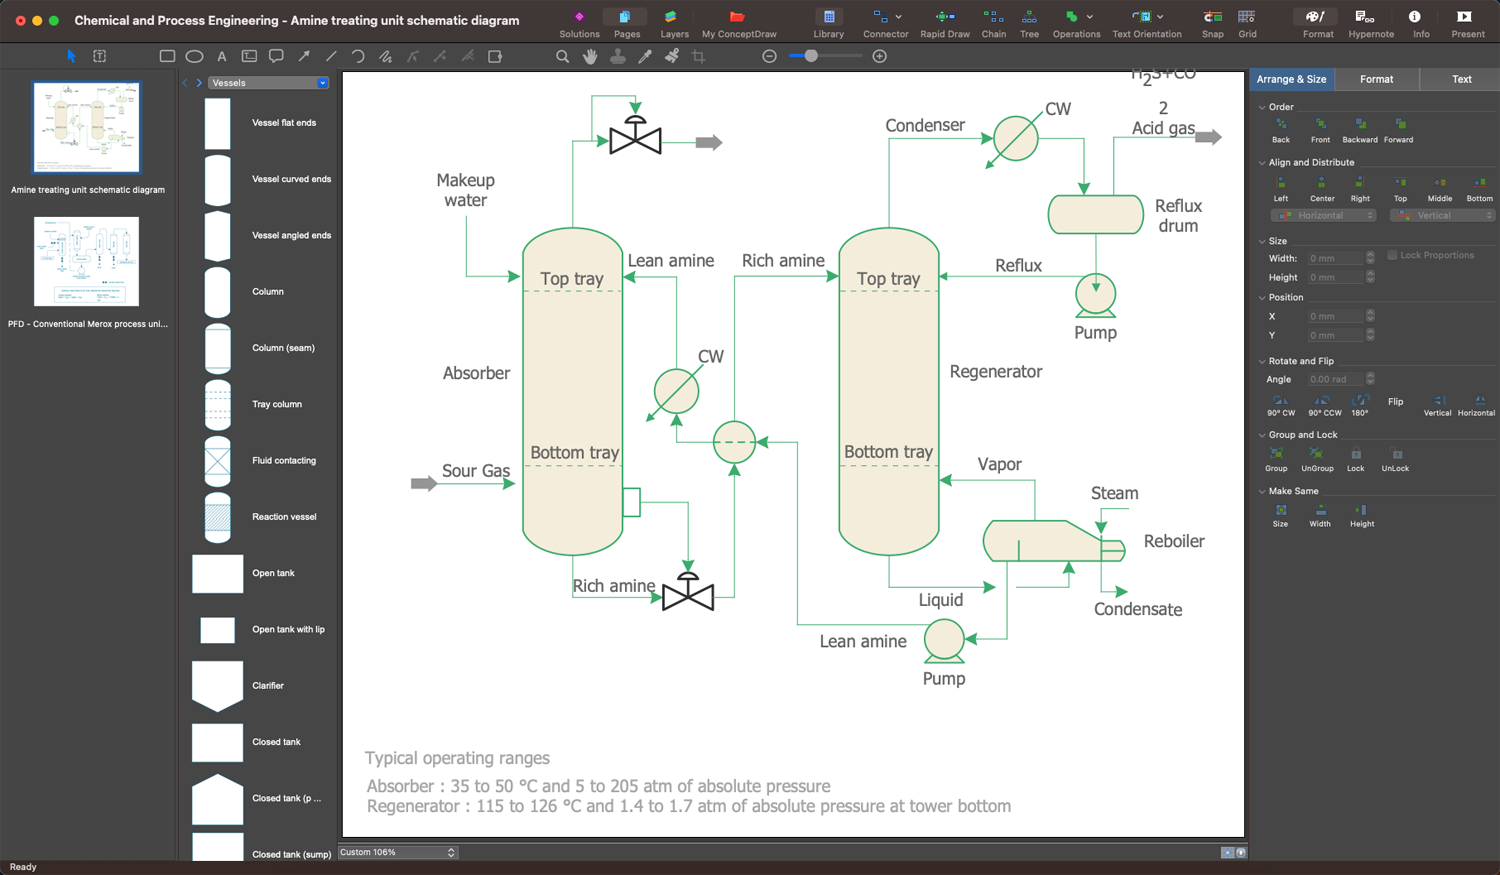
Example 3. Chemical Process Flow Diagram Template
The set of Process Diagrams you see on this page was created in ConceptDraw DIAGRAM software using the Chemical and Process Engineering Solution. These samples successfully demonstrate solution's capabilities and professional results you can achieve. An experienced user spent 10-20 minutes creating each of them.
Use the Chemical and Process Engineering Solution for ConceptDraw DIAGRAM software to create your own professional-looking Process Diagrams of any complexity quick, easy and effective, and then successfully use them in your work and scientific activity.
All source documents are vector graphic documents. They are available for reviewing, modifying, or converting to a variety of formats (PDF file, MS PowerPoint, MS Visio, and many other graphic formats) from the ConceptDraw STORE. The Chemical and Process Engineering Solution is available for all ConceptDraw DIAGRAM users.