The vector stencils library "Interactions" contains 18 interaction elements icons: mouse pointers, splitters, select frame.
Use it to design graphic user interface (GUI) prototypes of your software applications for Windows 8.
"In computing, a pointer or mouse cursor (as part of a personal computer WIMP style of interaction) is a graphical image on the computer monitor or other display device. The pointer echoes movements of the pointing device, commonly a mouse or touchpad, and signals the point where actions of the user take place. It can be used to select and move other graphical user interface elements, and is distinct from the cursor, which responds to keyboard input. The cursor may also be repositioned using the pointer.
The pointer commonly appears as an angled arrow, (angled because historically that improved appearance on low resolution screens) but it can vary within different programs or operating systems. The use of a pointer is employed when the input method, or pointing device, is a device that can move fluidly across a screen and select or highlight objects on the screen." [Pointer (graphical user interfaces). Wikipedia]
The design elements example "Interactions - Vector stencils library" was created using the ConceptDraw PRO diagramming and vector drawing software extended with the Windows 8 User Interface solution from the Software Development area of ConceptDraw Solution Park.
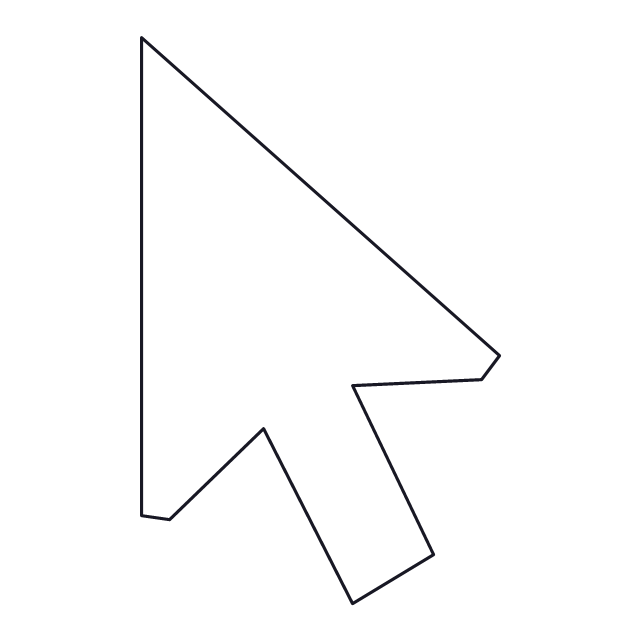
Normal select pointer
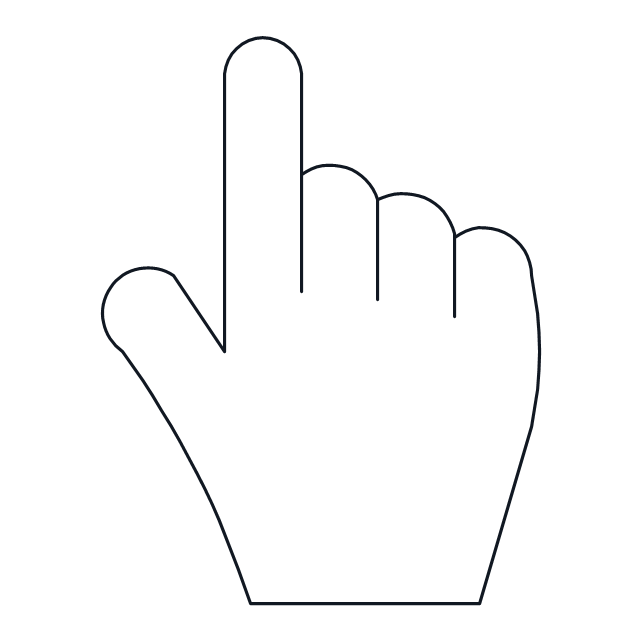
Link select pointer
Text select pointer
Precision select pointer
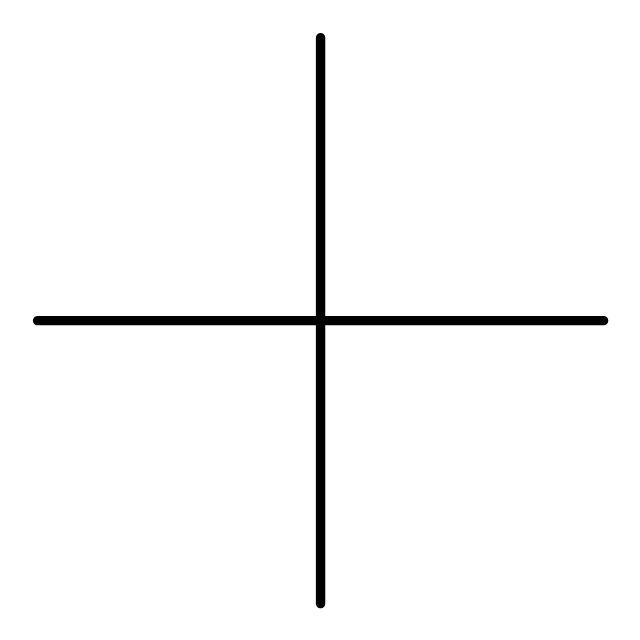
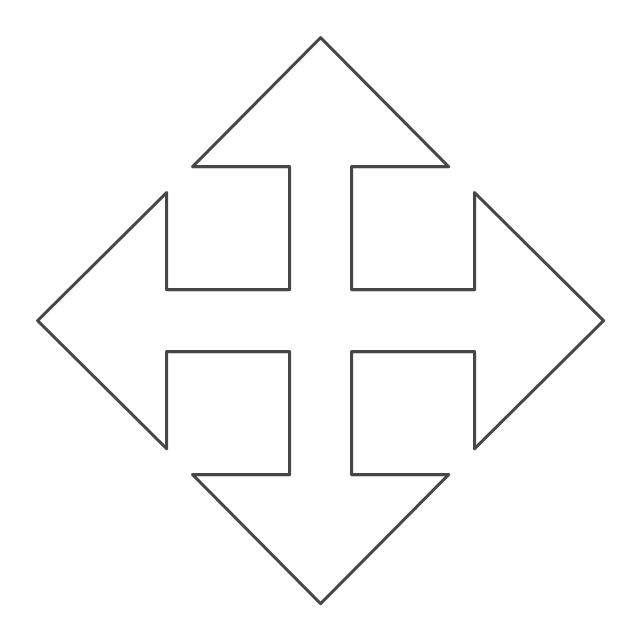
Move pointer
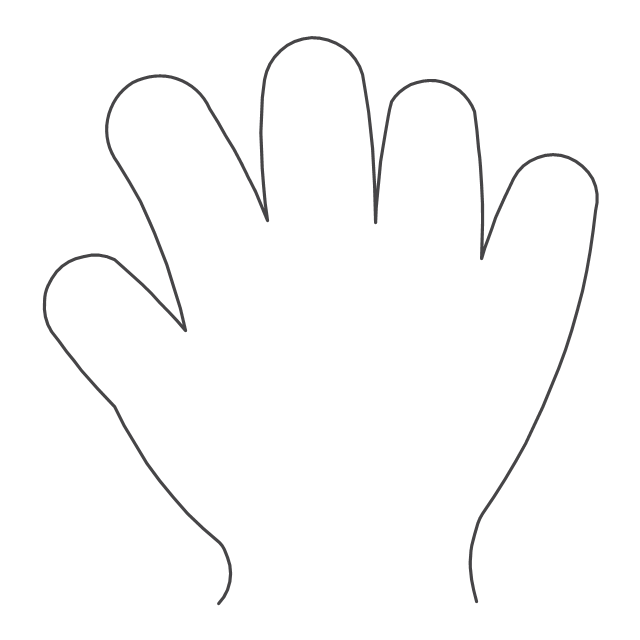
Pan pointer
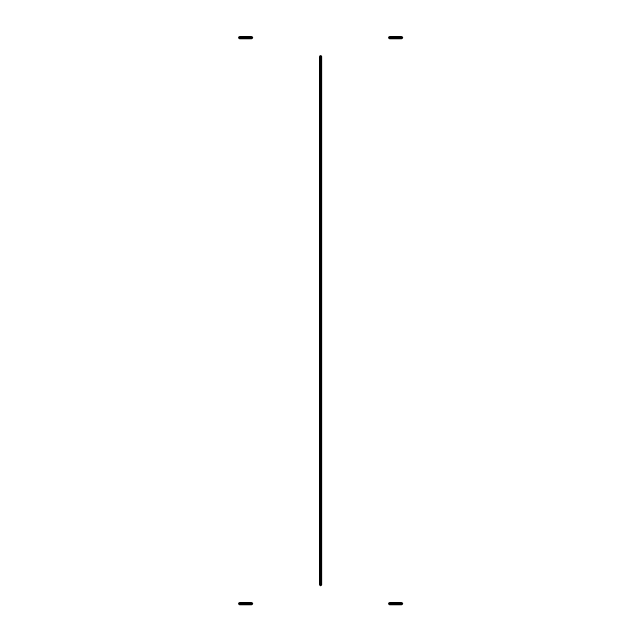
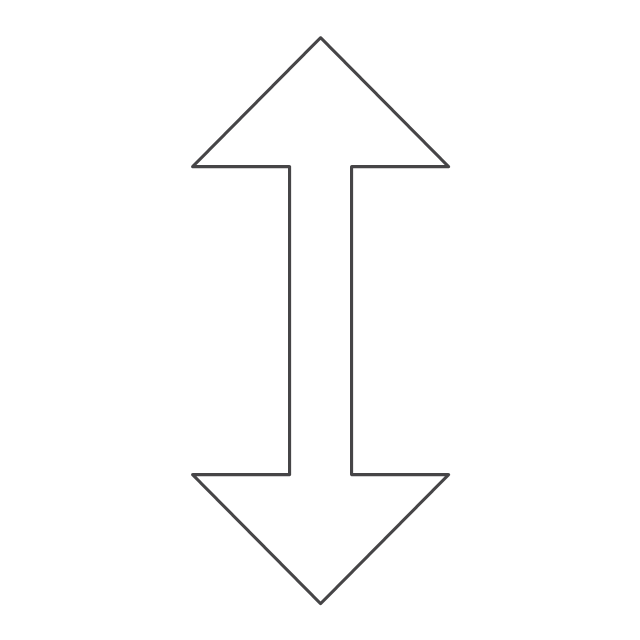
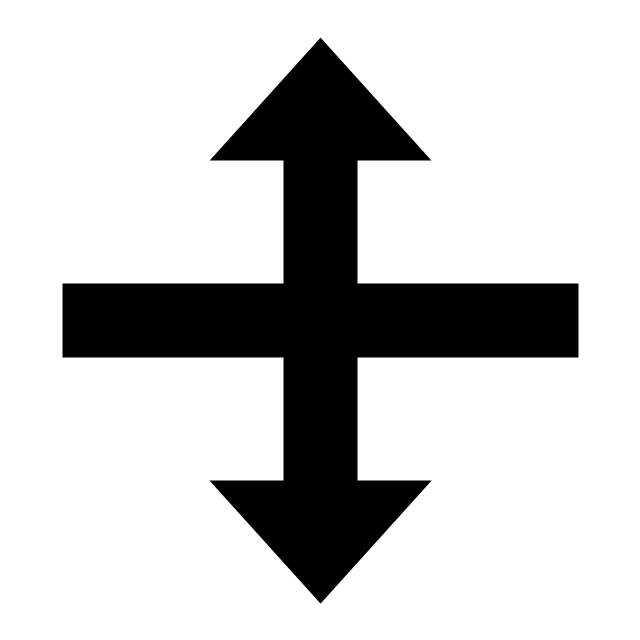
Vertical resize pointer
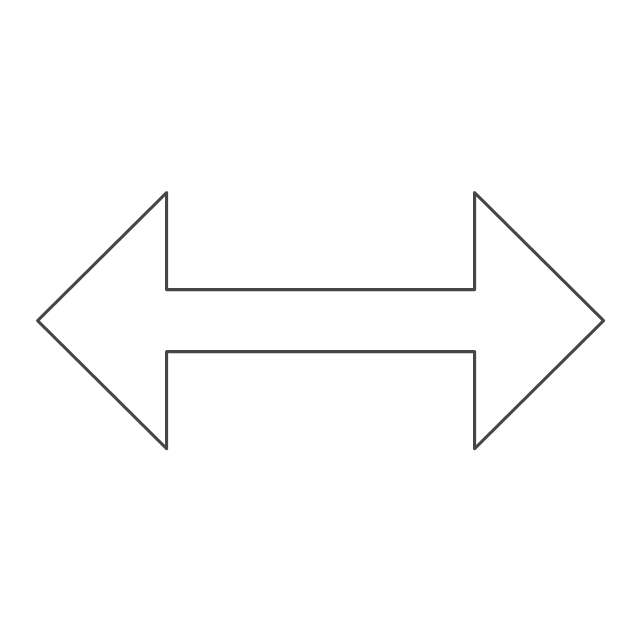
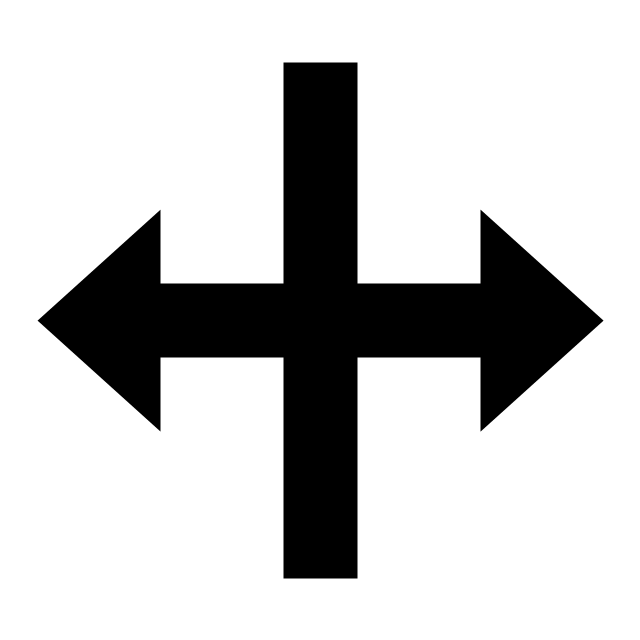
Horizontal resize pointer
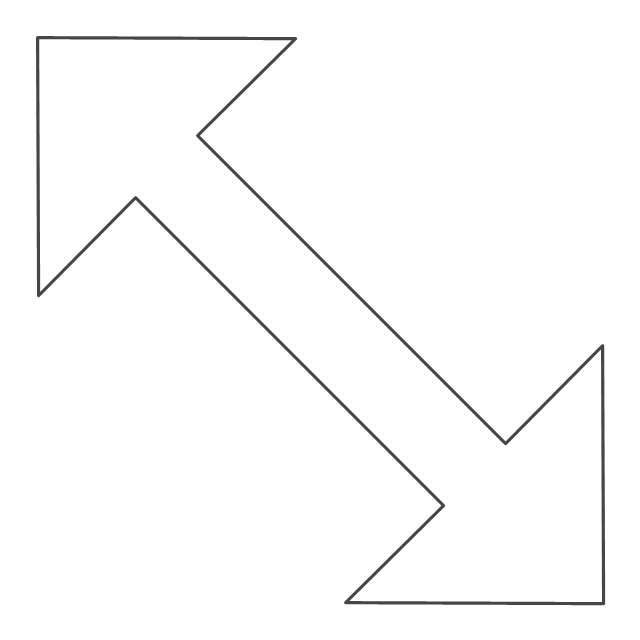
Diagonal resize pointer
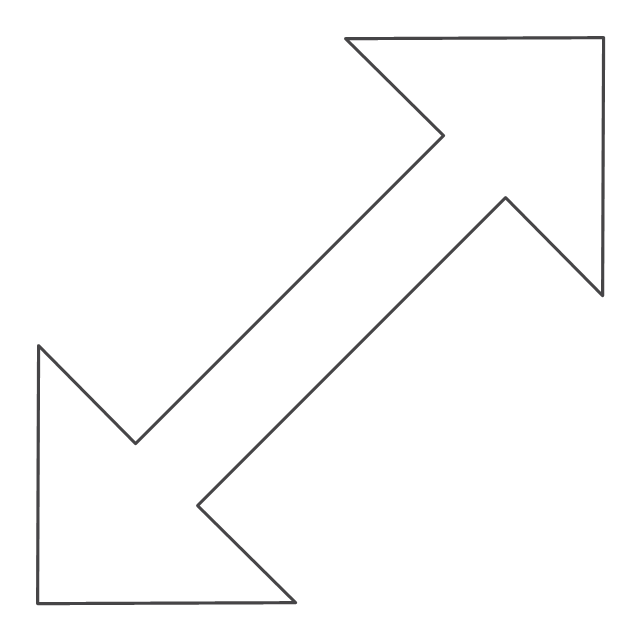
Diagonal resize pointer 2
Row resize pointer
Column resize pointer
Window splitter - vertically
Window splitter - horizontally
Working in background pointer

Busy pointer

Unavailable pointer

Normal select frame
How to Create a Bar Chart

Process Flowchart


HelpDesk
How to Create a Mind Map with Multiple Main Ideas

How to Build Cloud Computing Diagram Principal Cloud Manufacturing

Business Process Workflow Diagram


HelpDesk
How to Use a Cross - Functional Flowcharts Solution


Cross-Functional Flowchart

 Word Exchange
This solution extends ConceptDraw MINDMAP software with the ability to quickly create the framework for a future article or book, fill the structure with ideas, and use it to produce an MS Word document with just a simple click of the mouse.
Network Glossary Definition


Swim Lane Flowchart Symbols

HelpDesk
How To Convert a Computer Network Diagram to Adobe PDF

 Computer Network Diagrams
Computer Network Diagrams solution extends ConceptDraw PRO software with samples, templates and libraries of vector icons and objects of computer network devices and network components to help you create professional-looking Computer Network Diagrams, to plan simple home networks and complex computer network configurations for large buildings, to represent their schemes in a comprehensible graphical view, to document computer networks configurations, to depict the interactions between network's components, the used protocols and topologies, to represent physical and logical network structures, to compare visually different topologies and to depict their combinations, to represent in details the network structure with help of schemes, to study and analyze the network configurations, to communicate effectively to engineers, stakeholders and end-users, to track network working and troubleshoot, if necessary.
Accounting Flowchart Purchasing Receiving Payable and Payment

- Mouse Resize Png
- Link Select Mouse Pointer
- Interactions - Vector stencils library | Image Of Unavailable Mouse ...
- Mouse Resize
- Select Mouse
- Cursor Not Allowed Mouse
- Mouse Icon Vector Move
- Link Pointer Png
- Symbol The Mouse Makes When Resize Columns
- Interactions - Vector stencils library | iPhone OS (iOS) graphic user ...
- Images Of Normal Select
- Interactions - Vector stencils library | Interactions - Vector stencils ...
- Interactions - Vector stencils library | Design elements - Interactions ...
- Mouse Svg
- Interactions - Vector stencils library | Interactions - Vector stencils ...
- Interactions - Vector stencils library | MS Windows Vista user ...
- Interactions - Vector stencils library | Interactions - Vector stencils ...
- Windows Vista graphic user interface - Template | Interactions ...
- Keyboard Shortcuts and Mouse Actions | Hardware - Vector stencils ...
- Mouse Icon