This site uses cookies. By continuing to browse the ConceptDraw site you are agreeing to our Use of Site Cookies.

How to Create a Social Media DFD Flowchart

Interactive tool helps you create a social media DFD flowchart to find the appropriate response to social media mentions quickly.
It allows companies to be more effective in timely messaging thanks to the ability for rapid response to a customer′s post in social media. This saves budget for companies who use social media for promoting and as a lead generation tool.

Social Media Response Management DFD Charts - software tools

ConceptDraw is your tool for driving social integration and managing change across and streamline social media processes of your organisation.This tool keeps the entire team on the same page allowing you to realize your social media strategy, improve the quality of your answers, and minimize the time it takes to respond.

Management Tools — Total Quality Management

The Total Quality Management Diagram solution helps your organization visualize business and industrial processes. Create Total Quality Management diagrams for business process with ConceptDraw software.

Social Media Response DFD Flowcharts - diagramming software ( Mac PC )

Diagramming software for Mac and PC - create flowcharts and presentations for Social Media Organizing.

Relationships Analysis

Relationships Analysis. Relations Diagram - factors analysis, factors relations. Create Relations Diagram with ConceptDraw DIAGRAM.
The Seven Management and Planning Tools is a tool for Interaction diagram drawing. This diagram identifies causal relationships. Determine what factors are causes and which factors are effects. Interaction diagram helps establish KPIs to monitor changes and the effectiveness of corrective actions in resolving the problem.

Create Response Charts

Visual navigation through the stages of a response process helps you locate specific actions to be taken via Action Mind Maps. Use ConceptDraw DIAGRAM and ConceptDraw MINDMAP for organize the process of response for interactions occurring in social media.

How to Present a Social Media Response Plan DFD to Your Team

Interactive tool helps you find the appropriate response to social media mentions quickly. There are materials to help trainers and consultants develop a social media strategy and provide training for social media groups on how to effectively accomplish their daily work.

How to Connect Social Media DFD Flowchart with Action Maps

The Social Media Response solution creates interactive social media flow charts and action mind maps. The solution includes a video tutorial and a number of samples helping social media teams refine and organize their response process.

Seven Basic Tools of Quality — Quality Control

ConceptDraw DIAGRAM diagramming and vector drawing software extended with Seven Basic Tools of Quality solution from the Quality area of ConceptDraw Solution Park provides effective tools for quality control and helps design any types of quality-related diagrams.

Quality Control Chart Software — ISO Flowcharting

Quality Control Chart Software (ISO Flowcharting) - ConceptDraw DIAGRAM extended with Total Quality Management TQM Diagrams Solution from the Quality Management Area is the best diagramming and vector drawing software that allows you to draw the quality control charts quick and easy.
The quality control chart is a graphic that illustrates the accordance of processes or products to the intended specifications and degree of differences from them. Depending on what type of data you need analyze, there are used different types of quality control charts: X-bar charts, S charts, Np charts.

Flowchart Example: Flow Chart of Marketing Analysis

An example flowchart of marketing analysis shows main steps you have to challenge writing a marketing analysis.

Activity Network Diagram Method

Activity Network Diagram - This sample was created in ConceptDraw DIAGRAM diagramming and vector drawing software using the Seven Management and Planning Tools solution from the Management area of ConceptDraw Solution Park.
This sample shows the PERT (Program Evaluation Review Technique) chart of the request on proposal. A request for proposal (RFP) is a request of the company or the organization to potential suppliers to submit the business proposals for service or goods that it is interested to purchase. The RFP is represented on the initial procurement stage and allows to define the risks and benefits.

audio clipart, video clipart, photo camera clipart, CCTV Audio, Video, Media

audio clipart, video clipart, photo camera clipart, CCTV
Use it to make professional-looking documents, impressive presentations, and efficient websites with colorful and vivid illustrations and schematics of digital audio, video and photo gadgets and devices, audio video connections and configurations, S Video connection, HD and 3D television systems, home entertainment systems, Closed-circuit television (CCTV) surveillance systems. All audio video schematics, drawings and illustrations designed in ConceptDraw DIAGRAM are professional looking, clear and understandable for all thanks to applying the most commonly used standards of designations, and are effective for demonstrating in front of a small audience and on the big screens.

Using Fishbone Diagrams for Problem Solving

Problems are obstacles and challenges that one should overcome to reach the goal. They are an inseparable part of any business, and the success of an enterprise often depends on ability to solve all problems effectively. The process of problem solving often uses rational approach, helping to find a suitable solution.
Using Fishbone Diagrams for Problem Solving is a productive and illustrative tool to identify the most important factors causing the trouble. ConceptDraw DIAGRAM extended with Fishbone Diagrams solution from the Management area of ConceptDraw Solution Park is a powerful tool for problem solving with Fishbone Ishikawa diagram graphic method.

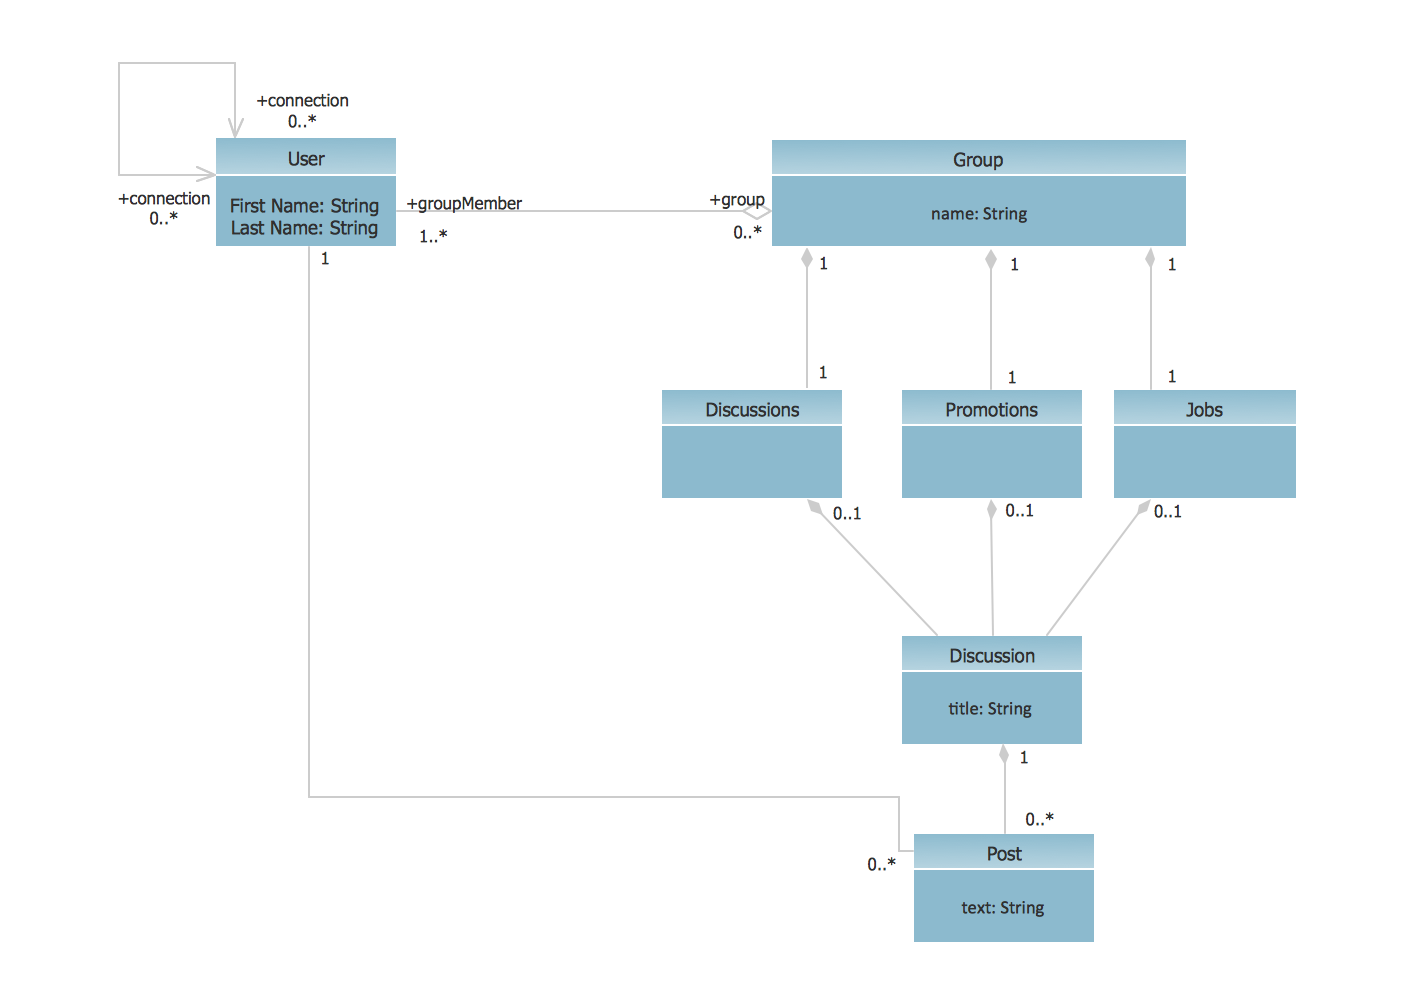
UML Class Diagram Example - Social Networking Site

UML Diagrams Social Networking Sites Project. This sample was created in ConceptDraw DIAGRAM diagramming and vector drawing software using the UML Class Diagram library of the Rapid UML Solution from the Software Development area of ConceptDraw Solution Park.
This sample shows the structure of the popular social networking site Linkedin and is used in the business field, in IT, at the projection and creating of the social networking sites.