This site uses cookies. By continuing to browse the ConceptDraw site you are agreeing to our Use of Site Cookies.

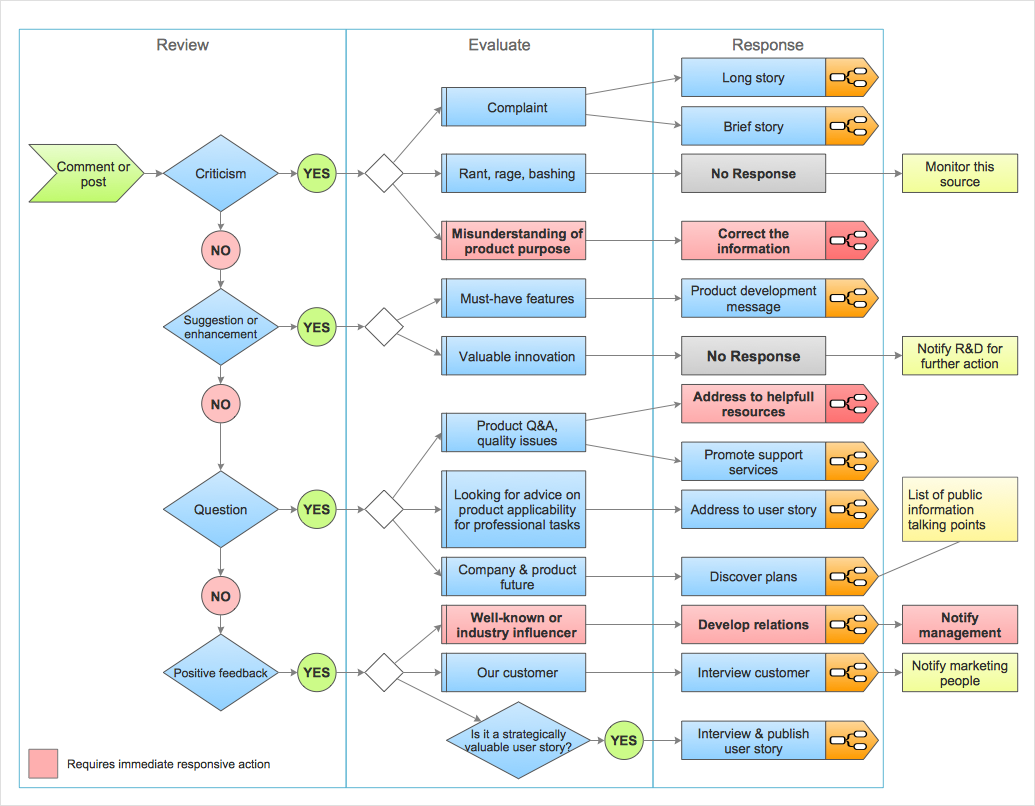
How to Create a Social Media DFD Flowchart

Interactive tool helps you create a social media DFD flowchart to find the appropriate response to social media mentions quickly.
It allows companies to be more effective in timely messaging thanks to the ability for rapid response to a customer′s post in social media. This saves budget for companies who use social media for promoting and as a lead generation tool.

Social Media Flowchart Symbols

Social media is a popular view of mass communication which allows people, companies and organizations create, share, discover, modify, access, comment, discuss and exchange information through the Internet. Social Media Response solution for ConceptDraw PRO provides collection of 10 libraries with diversity of predesigned vector social media flowchart symbols for fast and easy creating interactive Social Media Flowcharts, Response Charts and Action Mind Maps.

How to Connect Social Media DFD Flowchart with Action Maps

The Social Media Response solution creates interactive social media flow charts and action mind maps. The solution includes a video tutorial and a number of samples helping social media teams refine and organize their response process.

Social Media Response DFD Flowcharts - diagramming software ( Mac PC )

Diagramming software for Mac and PC - create flowcharts and presentations for Social Media Organizing.

Create Response Charts

Visual navigation through the stages of a response process helps you locate specific actions to be taken via Action Mind Maps. Use ConceptDraw PRO and ConceptDraw MINDMAP for organize the process of response for interactions occurring in social media.

Social Media Response Management DFD Charts - software tools

ConceptDraw is your tool for driving social integration and managing change across and streamline social media processes of your organisation.This tool keeps the entire team on the same page allowing you to realize your social media strategy, improve the quality of your answers, and minimize the time it takes to respond.

What is Interactive Flowcharts

Organizing and Selecting Social Media Response Messages.
Interactive Flowcharts can change the way one creates and organizes their social media response process.
HelpDesk

How To Create MS Visio Cross-Functional Flowchart

Cross-functional is a process involving several functional layers. Such processes typically cause the most problems, and therefore, is the most potential for improvement. Cross-functional business processes are usually illustrate the processes of product development, commercial proposal development, the order execution process - everything, that involves several departments. The package of possible improvements - is the task of re-engineering. To illustrate the cross-functional processes often use cross-functional flowchart is often used to illustrate the cross-functional processes. ConceptDraw PRO allows you to easily create cross-functional flowchart. Then, you can export it to MS Visio VSDX or VDX format and successfully share it with your colleagues still using MS Visio.
HelpDesk

How to Organize a Social Media Activity

Interactive Flowcharts describes the social media response process. Action Mind Maps shows examples of messages, and also defines the main objective of messaging for a specific situation.ConceptDraw Social Media Response solution helps to organize the process of response for interactions occurring in social media.

Business Diagram Software

ConceptDraw business diagram Software is the most powerful business and relational charting software. Create advanced, completely customizable flow charts, organizational charts, business process diagrams, work flow diagrams, audit diagram, value stream maps, TQM diagrams, ERD diagrams, EPC diagrams, marketing diagrams, cause and effect diagrams, dashboards, infographics and other relational business diagrams from your data.
Business Process Modeling
HelpDesk

How To Create MS Visio Flowchart

Flowchart is a diagram that successively depicts all process steps. Basic flowchart is the most easy and understandable type of a flowchart. Making a process or work flow step-by-step visualization helps you to better understand it and effectively communicate with your audience. Flowcharting is the best way to do this. Using ConceptDraw PRO you can design flowcharts of any complexity on Windows or OS X . Then you can export them to Visio format to share with the users of MS Visio. Moreover, using ConceptDraw PRO you can open and edit a flowchart made in Visio, regardless of whether you are using OS X or Windows.

Manage Social Media Response Plan DFD

The Social Media Response solution provides the means to respond to social media mentions quickly and professionally. This tool keeps the entire team on the same page allowing you to realize your social media strategy, improve the quality of your answers, and minimize the time it takes to respond.

Flow chart Example. Warehouse Flowchart

Warehouse Flowcharts are different diagrams describing wharehousing and inventory menagement processes. Typical purposes of warehouse flowcharts are evaluating warehouse performance and organizational performance, measuring efficiency of customer service. This type of workflow diagrams can be used for identifying any disconnection between business activities and business objectives.
Standard warehousing process flow diagram and standard workflow diagram used for process identification for further evaluating effectiveness and profitability of overall business process. Use the ConceptDraw PRO diagramming and vector drawing software extended with the Flowcharts solution from the Diagrams area of ConceptDraw Solution Park to design your own workflow diagrams, process flow diagram and flow charts. Need to use Process Flow Diagram for designing Warehouse packages flow.
ConceptDraw Arrows10 Technology
HelpDesk

How to Create a Timeline Diagram in ConceptDraw PRO

A Timeline is a chart which displays a project plan schedule in chronological order. A Timeline is used in project management to depict project milestones and visualize project phases, and show project progress. The graphic form of a timeline makes it easy to understand critical project milestones, such as the progress of a project schedule. Timelines are particularly useful for project scheduling or project management when accompanied with a Gantt chart. It captures the main of what the project will accomplish and how it will be done. making a project timeline is one of the most important skills a project manager needs have. Making comprehensive, accurate timelines allows you getting every project off in the best way. ConceptDraw PRO allows you to draw a timeline charts using special library.