"In mathematics, the Euclidean algorithm, or Euclid's algorithm, is a method for computing the greatest common divisor (GCD) of two (usually positive) integers, also known as the greatest common factor (GCF) or highest common factor (HCF). ...
The GCD of two positive integers is the largest integer that divides both of them without leaving a remainder (the GCD of two integers in general is defined in a more subtle way).
In its simplest form, Euclid's algorithm starts with a pair of positive integers, and forms a new pair that consists of the smaller number and the difference between the larger and smaller numbers. The process repeats until the numbers in the pair are equal. That number then is the greatest common divisor of the original pair of integers.
The main principle is that the GCD does not change if the smaller number is subtracted from the larger number. ... Since the larger of the two numbers is reduced, repeating this process gives successively smaller numbers, so this repetition will necessarily stop sooner or later - when the numbers are equal (if the process is attempted once more, one of the numbers will become 0)." [Euclidean algorithm. Wikipedia]
The flowchart example "Euclidean algorithm" was created using the ConceptDraw PRO diagramming and vector drawing software extended with the Mathematics solution from the Science and Education area of ConceptDraw Solution Park.
Euclid's algorithm flow chart

Basic Flowchart Symbols and Meaning


 Mathematics
Mathematics solution extends ConceptDraw PRO software with templates, samples and libraries of vector stencils for drawing the mathematical illustrations, diagrams and charts.
Types of Flowchart - Overview


Best Vector Drawing Application for Mac OS X

Scientific Symbols Chart

Mathematics Solution from the Science and Education area of ConceptDraw Solution Park includes a few shape libraries of plane, solid geometric figures, trigonometrical functions and greek letters to help you create different professional looking mathematic illustrations for science and education.
 Flowcharts
The Flowcharts solution for ConceptDraw PRO is a comprehensive set of examples and samples in several varied color themes for professionals that need to represent graphically a process. Solution value is added by the basic flow chart template and shapes' libraries of flowchart notation. ConceptDraw PRO flow chart creator lets one depict the processes of any complexity and length, as well as design the Flowchart either vertically or horizontally.
HelpDesk
How to Draw Geometric Shapes in ConceptDraw PRO

Account Flowchart. Flowchart Examples

The Best Drawing Program for Mac

Best Multi-Platform Diagram Software

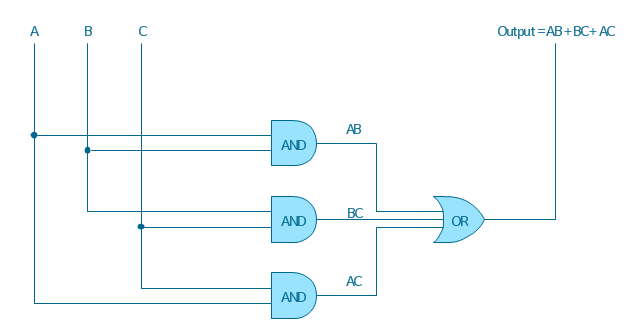
"A logic gate is an idealized or physical device implementing a Boolean function, that is, it performs a logical operation on one or more logical inputs, and produces a single logical output. Depending on the context, the term may refer to an ideal logic gate, one that has for instance zero rise time and unlimited fan-out, or it may refer to a non-ideal physical device...
Logic gates are primarily implemented using diodes or transistors acting as electronic switches, but can also be constructed using electromagnetic relays (relay logic), fluidic logic, pneumatic logic, optics, molecules, or even mechanical elements. With amplification, logic gates can be cascaded in the same way that Boolean functions can be composed, allowing the construction of a physical model of all of Boolean logic, and therefore, all of the algorithms and mathematics that can be described with Boolean logic.
Logic circuits include such devices as multiplexers, registers, arithmetic logic units (ALUs), and computer memory, all the way up through complete microprocessors, which may contain more than 100 million gates. In practice, the gates are made from field-effect transistors (FETs), particularly MOSFETs (metal–oxide–semiconductor field-effect transistors).
Compound logic gates AND-OR-Invert (AOI) and OR-AND-Invert (OAI) are often employed in circuit design because their construction using MOSFETs is simpler and more efficient than the sum of the individual gates.
In reversible logic, Toffoli gates are used." [Logic gate. Wikipedia]
The logic gate diagram template for the ConceptDraw PRO diagramming and vector drawing software is included in the Electrical Engineering solution from the Engineering area of ConceptDraw Solution Park.
Logic gate diagram
3 Circle Venn Diagram. Venn Diagram Example

Introduction to bookkeeping: Accounting flowchart process

- Euclidean algorithm - Flowchart | Mathematics | Maths Vs Computer ...
- Maths VS Computer Flowchart
- A Flow Chart Of Math Vs Computer Algorithm
- Algorithm Flowchart Diagram
- How To Solve Flow Charts In Computer Programming Mathematics
- Euclidean algorithm - Flowchart | Solving quadratic equation ...
- Flow Chart In Pc Start Stop
- Basic Flowchart Symbols and Meaning | Algorithm flowchart ...
- Solving quadratic equation algorithm - Flowchart | Mathematics ...
- Euclidean algorithm - Flowchart | Basic Flowchart Symbols and ...
- Selection sorting method - Algorithm flowchart | Algorithm flowchart ...
- Flow Chart Online | Algorithm flowchart - Selection sorting method ...
- Algorithm flowchart - Selection sorting method | Flow Chart Design ...
- Flowchart In Computer Programming Examples
- Flow Chart for Olympic Sports | Selection sorting method - Algorithm ...
- Solving quadratic equation algorithm - Flowchart | Euclidean ...
- Basic Diagramming | Euclidean algorithm - Flowchart | Accounting ...
- Algorithm flowchart - Selection sorting method | Diagram Flow Chart ...
- Solving quadratic equation algorithm - Flowchart | Basic Flowchart ...
- Basic Diagramming | Euclidean algorithm - Flowchart | How to Draw ...