This site uses cookies. By continuing to browse the ConceptDraw site you are agreeing to our Use of Site Cookies.

marketing, process, chart, Marketing Charts, Marketing Diagrams,  solution park Marketing

marketing, process, chart, Marketing Charts, Marketing Diagrams,  solution park
This solution extends ConceptDraw DIAGRAM and ConceptDraw MINDMAP with Marketing Diagrams and Mind Maps (brainstorming, preparing and holding meetings and presentations, sales calls).

target diagram, circular diagram, circle diagram Target and Circular Diagrams

target diagram, circular diagram, circle diagram
This solution extends ConceptDraw DIAGRAM software with samples, templates and library of design elements for drawing the Target and Circular Diagrams.

SWOT Analysis

The SWOT Analysis provides information that is helpful in matching the firm's resources and capabilities to the competitive environment in which it operates. As such, it is instrument in strategy formulation and selection. SWOT analysis is a method of strategic planning which identifies the factors internal and external environment of the firm and divides them into 4 categories: strengths, weaknesses, opportunities and threats. The ConceptDraw DIAGRAM and MINDMAP software allow professional to make well-designed SWOT matrix in minutes.

What is SWOT Analysis?

SWOT analysis (SWOT Matrix) is a structured planning method used to evaluate the Strengths, Weaknesses, Opportunities, and Threats involved in a project or in a business venture.

What is SWOT Analysis in Marketing

The ConceptDraw DIAGRAM and MINDMAP software allow professional to make well-designed SWOT matrix in minutes. The SWOT Analysis solution includes the SWOT matrix samples, and templates that allow users create own SWOT diagram.

SWOT analysis Software & Template for Macintosh and Windows

The ConceptDraw is a SWOT analysis software developed for Macintosh and Windows OS.

stakeholder management, stakeholder onion diagram template, onion diagram process design, stakeholder analysis Stakeholder Onion Diagrams

stakeholder management, stakeholder onion diagram template, onion diagram process design, stakeholder analysis
The Stakeholder Onion Diagram is often used as a way to view the relationships of stakeholders to a project goal. A basic Onion Diagram contains a rich information. It shows significance of stakeholders that will have has influence to the success achieve

SWOT Analysis Software

SWOT Analysis solution from ConceptDraw Solution Park contains easy-to-use mind map templates that help identify Strengths, Weaknesses, Opportunities, and Threats using ConceptDraw MINDMAP software, as well as outputs to ConceptDraw DIAGRAM for presenting analysis results as SWOT and TOWS matrices.

SWOT Analysis Solution - Strategy Tools

A SWOT analysis helps professionals to identify the positives and negatives in the organization and in the external environment.

Cause and Effect Diagram

ConceptDraw DIAGRAM software extended with Fishbone Diagrams solution from the Management area of ConceptDraw Solution Park is perfect for Cause and Effect Diagram creating. It gives the ability to draw fishbone diagram that identifies many possible causes for an effect or a problem. Causes and Effects are usually grouped into major categories to identify these sources of variation. Causes and Effects in the diagram show relationships among various factor. Fishbone diagram shows factors of Equipment, Process, People, Materials, Environment and Management, all affecting the overall problem.

project management, planning, meeting, dashboards, teams, presentation, solution park Project Management Area

project management, planning, meeting, dashboards, teams, presentation, solution park
Project Management area provides Toolbox solutions to support solving issues related to planning, tracking, milestones, events, resource usage, and other typical project management functions.
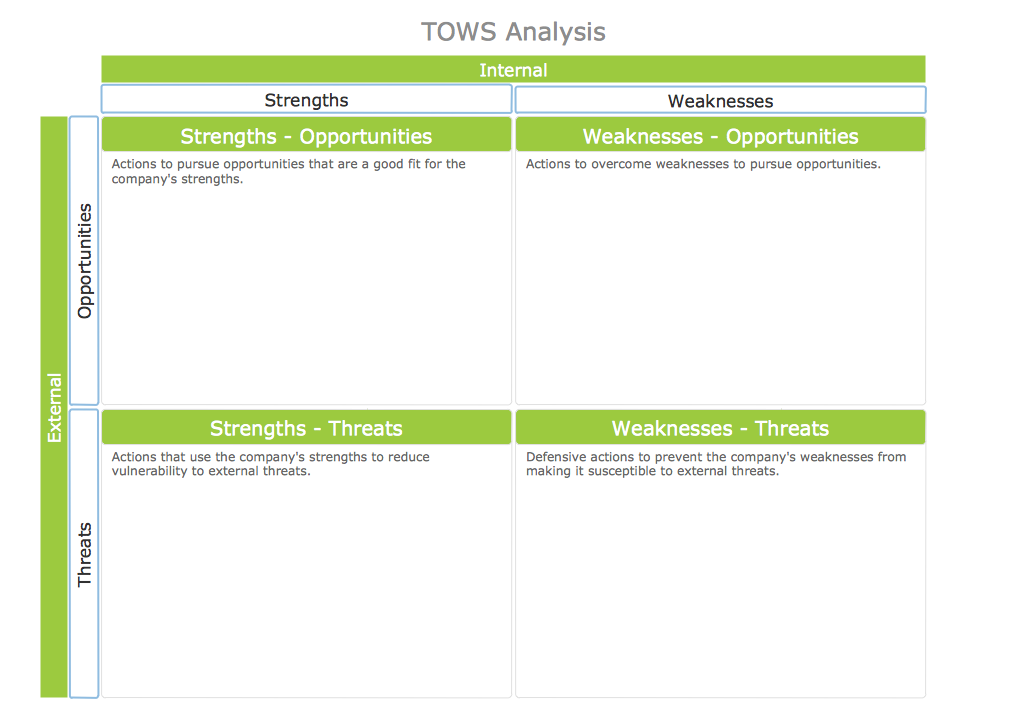
TOWS Analysis

TOWS Analysis is a variant of the classic business tool - SWOT analysis, but it is directed more outside. It allows you to analyze the internal environment (weaknesses and strengths) and to plan your own changes through the analysis of changes in the external environment (threats and opportunities).
ConceptDraw DIAGRAM extended with unique SWOT and TOWS Matrix Diagrams Solution from the Management Area is a powerful software for effective TOWS analysis.

Ishikawa Diagram

In almost every sphere of life and work the people time to time are faced with the fact that on their way there are certain obstacles and problems. But it is not always possible to identify the true cause of particular problem. To understand the basic causes of problems and eliminate them, it is convenient to use the chart of Kaoru Ishikawa - the technique specially designed for this.
ConceptDraw DIAGRAM diagramming and vector drawing software extended with Fishbone Diagrams solution from the Management area can help you with construction the Fishbone Diagram also known as Ishikawa Diagram.
Ishikawa Diagram shows factors of Equipment, Process, People, Materials, Environment and Management, all affecting the overall problem in one drawing for the further analysis. It is a well effective way to analyze the business problems you must identify and solve.