 Bar Graphs
The Bar Graphs solution enhances ConceptDraw PRO v10 functionality with templates, numerous professional-looking samples, and a library of vector stencils for drawing different types of Bar Graphs, such as Simple Bar Graph, Double Bar Graph, Divided Bar Graph, Horizontal Bar Graph, Vertical Bar Graph, and Column Bar Chart.
 Business and Finance
Business and Finance solution extends ConceptDraw PRO software with samples, templates and vector stencils libraries with currency, money, office, time, contacts and collaboration clipart for drawing business, management, advertising, project management
 Cross-Functional Flowcharts
Cross-functional flowcharts are powerful and useful tool for visualizing and analyzing complex business processes which requires involvement of multiple people, teams or even departments. They let clearly represent a sequence of the process steps, the order of operations, relationships between processes and responsible functional units (such as departments or positions).
 Marketing
This solution extends ConceptDraw PRO v9 and ConceptDraw MINDMAP v7 with Marketing Diagrams and Mind Maps (brainstorming, preparing and holding meetings and presentations, sales calls).
 Flowcharts
The Flowcharts Solution for ConceptDraw PRO v10 is a comprehensive set of examples and samples in several different color themes for professionals that need to graphically represent a process. Solution value is added by basic flow chart template and shapes' library of Flowchart notation. ConceptDraw PRO flow chart creator lets one depict a processes of any complexity and length, as well design of the flowchart either vertically or horizontally.
 PM Meetings
This solution extends ConceptDraw MINDMAP software, by making meeting preparation a quick and simple task.
 Project Management Area
Project Management area provides Toolbox solutions to support solving issues related to planning, tracking, milestones, events, resource usage, and other typical project management functions.
 PM Planning
This solution extends ConceptDraw MINDMAP and ConceptDraw Project software, allowing you to automatically create documents that reflect a project's status, for people who have different project roles.
 Quality Mind Map
This solution extends ConceptDraw MINDMAP software with Quality Management Mind Maps (Presentations, Meeting Agendas, Problem to be solved).
Sales Teams are Inherently Competitive
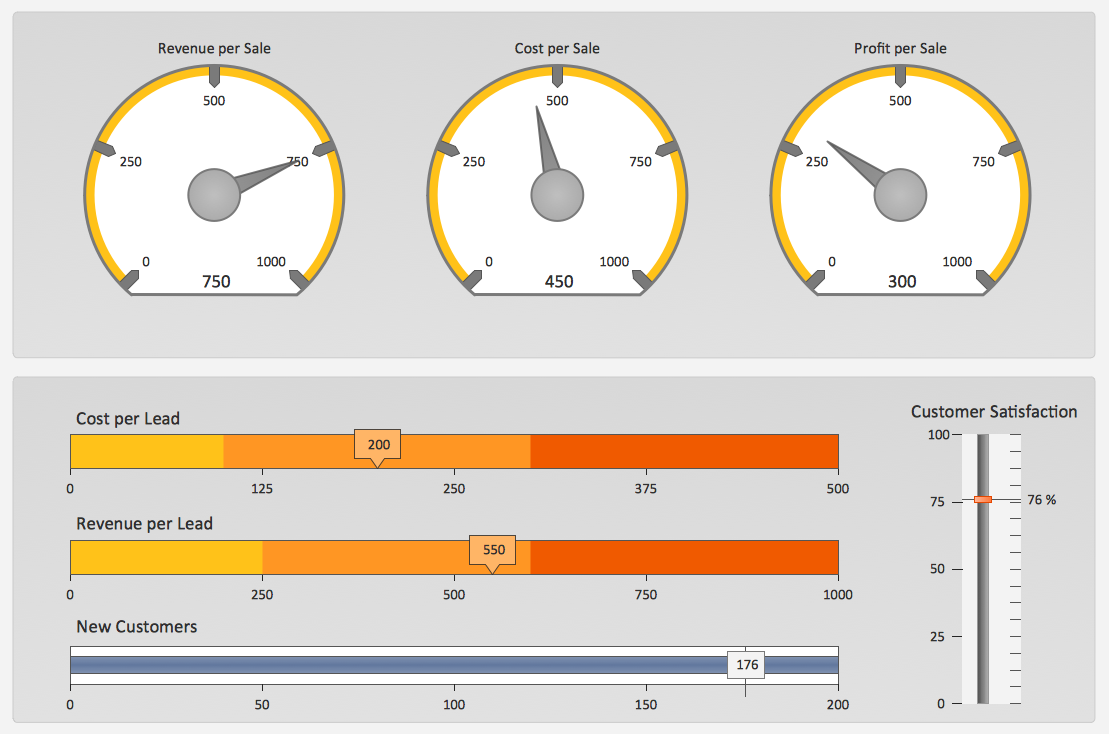
Sales teams are inherently competitive, so you don't need to invent extra ways to stimulate the competition. At the same time, you can provide the team with a sales dashboard shows company, team and personal KPI to make the competition clear.A KPI Dashboard Provides the Answers Your Sales Team
Sales dashboard is a tool that provides the answers to all questions your sales team may have. A mature sales dashboard provides complete set of KPI to shows corporate, team or personal performance to keep sales process clear.Customer Relationship Management
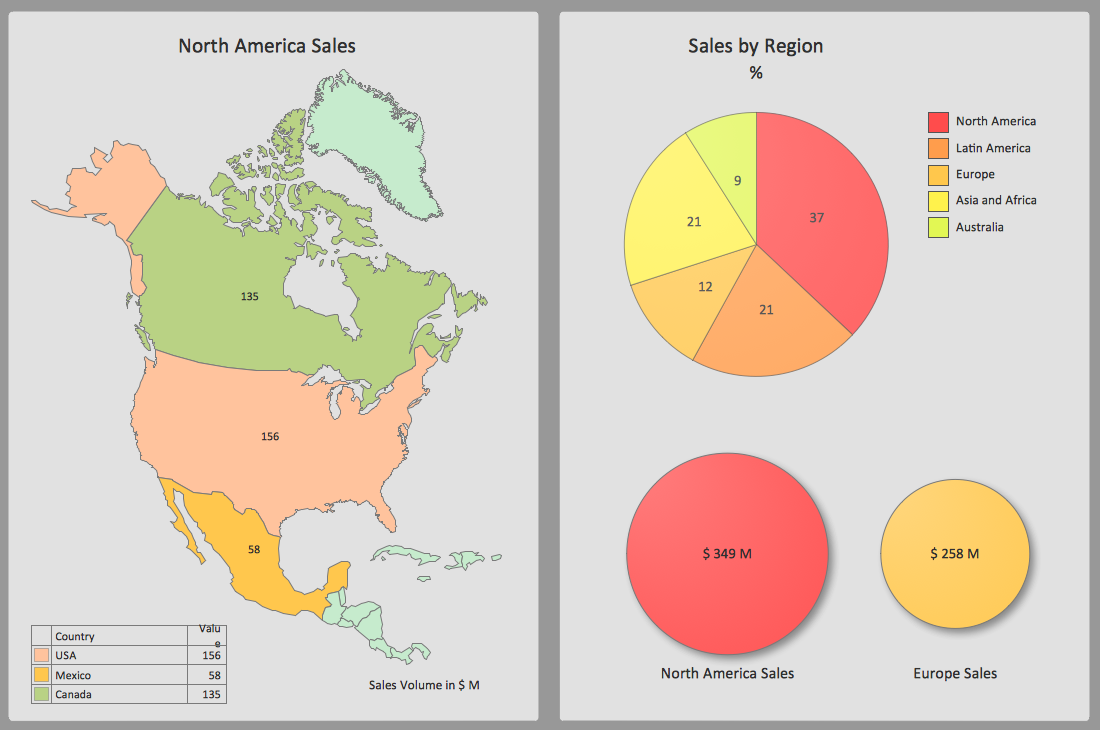
Customer relationship management is an important component of sales success. Visualizing sales data you may put some KPI related to customers relationship management to your Sales dashboard and track this important aspect in real time.Data Visualization Software Solutions
To see how your business can improve you can try data visualization software solutions that allows you visualize all your sales KPI in one sales dashboard allows you monitor and analyse sales activities.How To Create a Bubble Chart
Bubble diagrams solution extends ConceptDraw PRO software with templates, Using ConceptDraw Connectors, you can create a bubble chart in moments.Using ConceptDraw you will be able to create a bubble chart from the ready ConceptDraw library objects or make your own objects. The created diagram can represent ideas organization, in brainstorming processes, by teachers for explaining difficult ideas or for presentations.
TQM Diagram Tool
The Total Quality Management Diagram solution helps you and your organization visualize business and industrial processes. Create Total Quality Management diagrams for business process with ConceptDraw software.A KPI Dashboard
Composing a dashboard from different KPI is a kind of art. Visualizing sales data you have to keep balance to keep your dashboard informative, not messy. ConceptDraw Sales Dashboard solution gives you a set of good examples of balanced dashboards.Sales Dashboard Screenshot
ConceptDraw PRO software exteneded with the Sales Dashboard solution is perfect for visualizing sales data. This is the best tool to analyse your sales perfornance and see how your business can improve.- Picture Graphs | Picture graph template | Design elements - Picture ...
- Picture Graphs | SWOT Sample in Computers | How to Draw a ...
- Picture Graphs | Universal Diagramming Area | Network Diagram ...
- Work Flow Process Chart | Design elements - Picture graphs ...
- Seven Management and Planning Tools | Decision Making ...
- Create Graphs and Charts | Basic Diagramming | Line Graph ...
- Mind Maps for Business - SWOT Analysis | Decision Making ...
- How to Draw a Computer Network Diagrams | Picture Graphs ...
- Picture graph template | Business and Finance Illustrations ...
- Management | Audit Flowcharts | Flowcharts | - Conceptdraw.com
- Best Multi-Platform Diagram Software | Create Graphs and Charts ...
- Conceptdraw.com: Mind Map Software, Drawing Tools | Project ...
- Bar Diagrams for Problem Solving. Create business management ...
- Network Visualization with ConceptDraw PRO | Applications ...
- Marketing | PM Agile | Comparison Dashboard | - Conceptdraw.com
- Management | Business Processes | Marketing | - Conceptdraw.com
- Management | Chore charts with ConceptDraw PRO | Create ...
- Organizational Structure | How to Draw an Organization Chart ...
- What is Infographics Area | Wireless Networks | Data Flow Diagrams |
- How to Draw an Organization Chart | Pie Charts | PM Easy |


