Line Graph Charting Software

Bar Chart Software

Chart Maker for Presentations

How to Draw a Line Graph

How to Create a Line Chart

What Is a Line Chart

Chart Templates

Line Chart

Scatter Graph Charting Software

Chart Examples

Chart Software for Better Presentations

The vector stencils library "Line graphs" contains 5 templates of line graphs and scatter charts for visualizing data changes over time. Drag a template from the library to your document and enter your data.
Use these shapes to draw your line and scatter charts in the ConceptDraw PRO diagramming and vector drawing software.
The vector stencils library "Line graphs" is included in the Line Graphs solution from the Graphs and Charts area of ConceptDraw Solution Park.
Use these shapes to draw your line and scatter charts in the ConceptDraw PRO diagramming and vector drawing software.
The vector stencils library "Line graphs" is included in the Line Graphs solution from the Graphs and Charts area of ConceptDraw Solution Park.
Line graph (text -> height)
-line-graphs---vector-stencils-library.png--diagram-flowchart-example.png)
Line graph (control dots)
-line-graphs---vector-stencils-library.png--diagram-flowchart-example.png)
Scatter chart (text -> height)
-line-graphs---vector-stencils-library.png--diagram-flowchart-example.png)
Scatter chart (control dots)
-line-graphs---vector-stencils-library.png--diagram-flowchart-example.png)
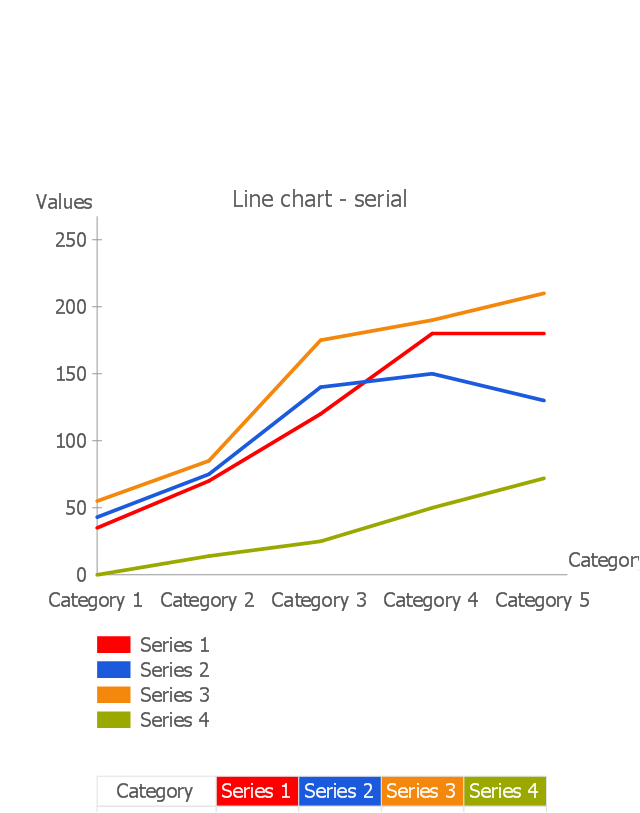
Line chart - serial
What Is a Picture Graph?

Picture Graph

Software Work Flow Process in Project Management with Diagram

This sample shows the Workflow Diagram that clearly illustrates stages a BPM consists of and relations between all parts of business. The Workflow Diagrams are used to represent the transferring of data during the work process, to study and analysis the working processes, and to optimize a workflow.
PERT Chart Software

Line Chart Examples

Basic Diagramming


Column Chart Software

Restaurant Floor Plans Software

- Line Graph Charting Software | Basic Diagramming | How to Draw a ...
- Line Graphs | Line Graph Charting Software | How to Draw a Line ...
- Line Graphs | What Are Line Graphs Used For In Management
- Bar Graphs | Line Graph Charting Software | How to Draw a Line ...
- Line Graph Charting Software
- Chart Maker for Presentations | Line Graph Charting Software | Line ...
- Outstanding trends of wastewater treatment plants | Line Graph ...
- Line Chart Examples | Line Graph Charting Software | Chart ...
- Chart Maker for Presentations | Line Graph | Blank Calendar Template