A KPI Dashboard Provides the Answers Your Sales Team

How To Create Project Report

KPIs and Metrics

Sales Teams are Inherently Competitive
Reporting Dashboard Software for Business
How To Plan and Implement Projects Faster

Advanced printing in ConceptDraw PROJECT

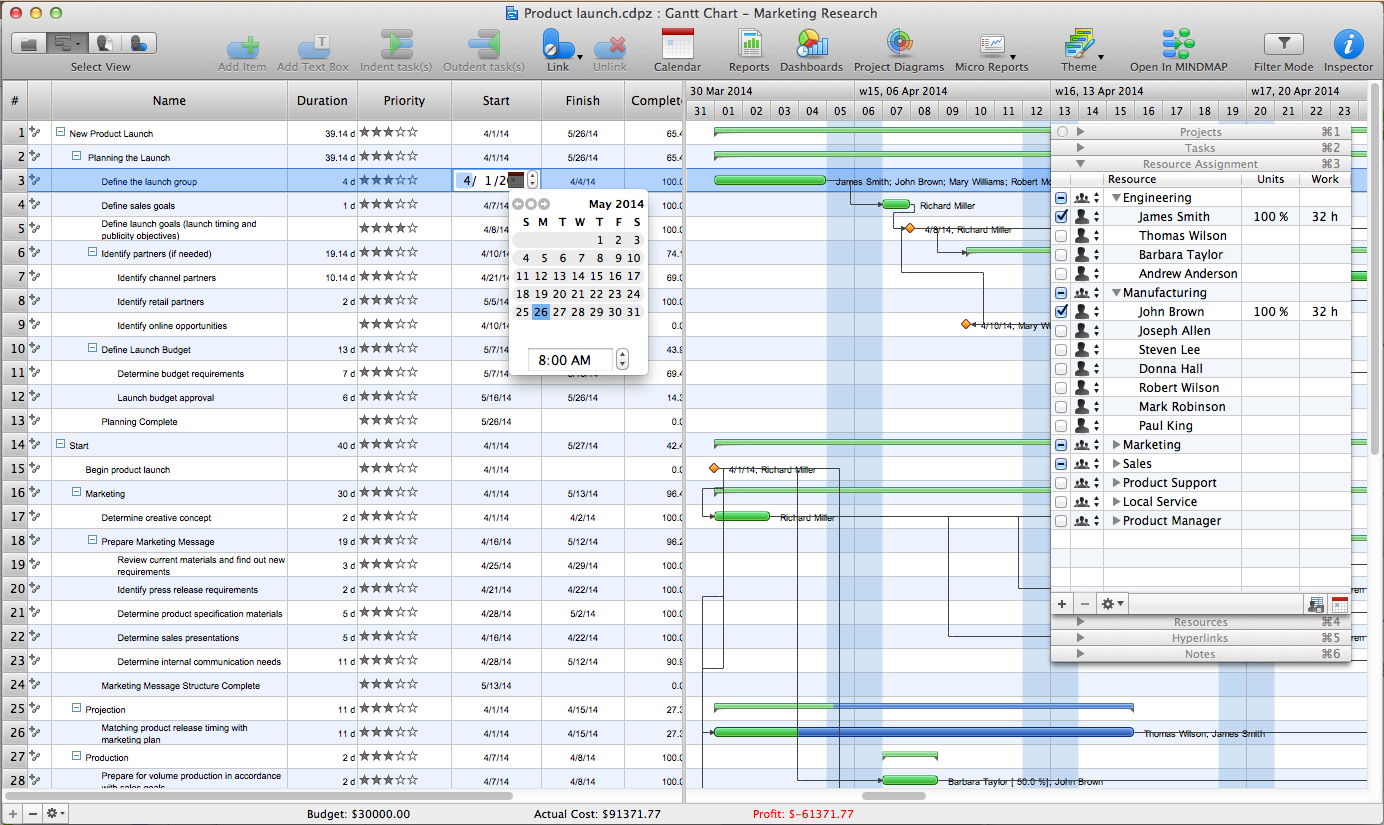
Advanced Resource Assignment in ConceptDraw PROJECT
Business Diagram Software


Critical Path Method in ConceptDraw PROJECT

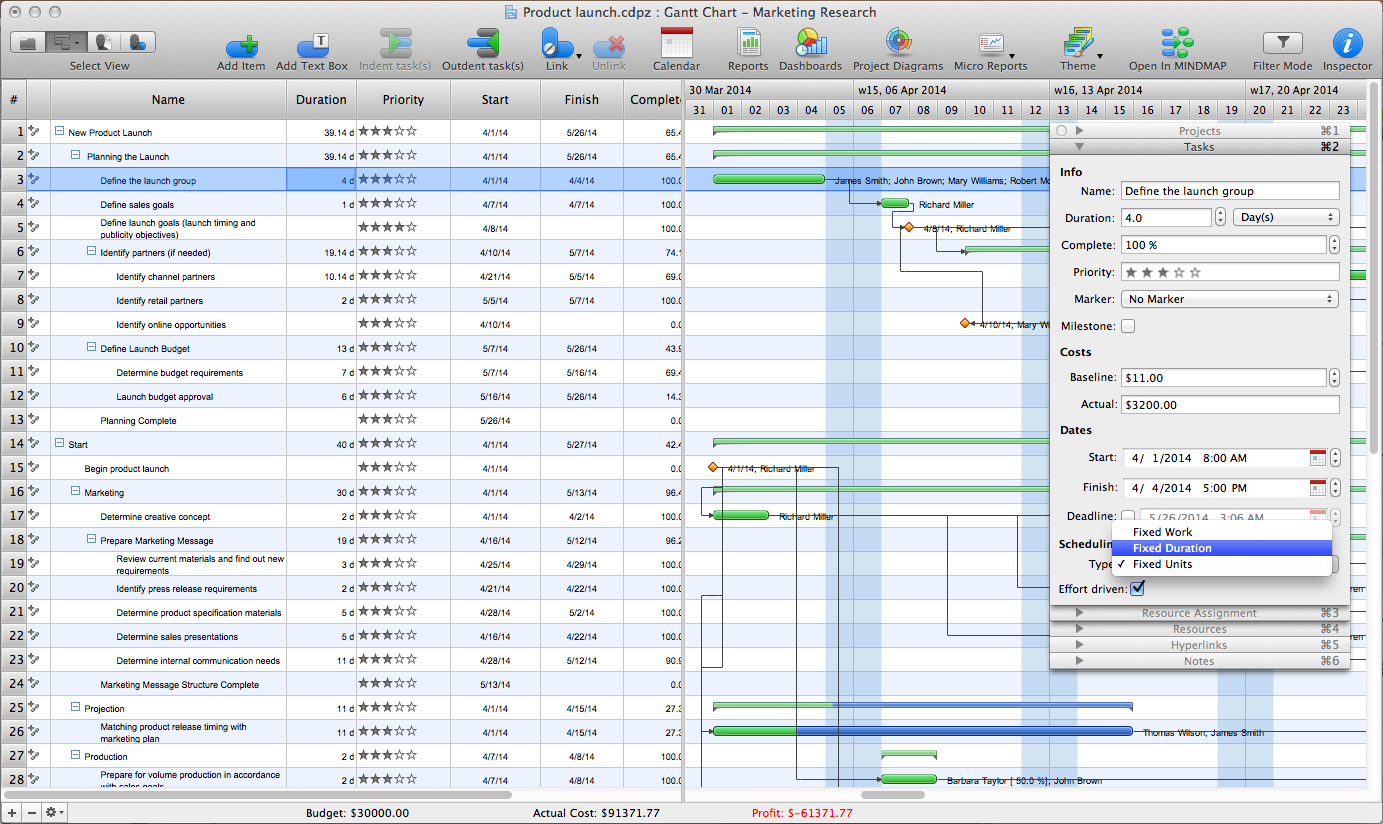
Task Types in ConceptDraw PROJECT
Sales Organization
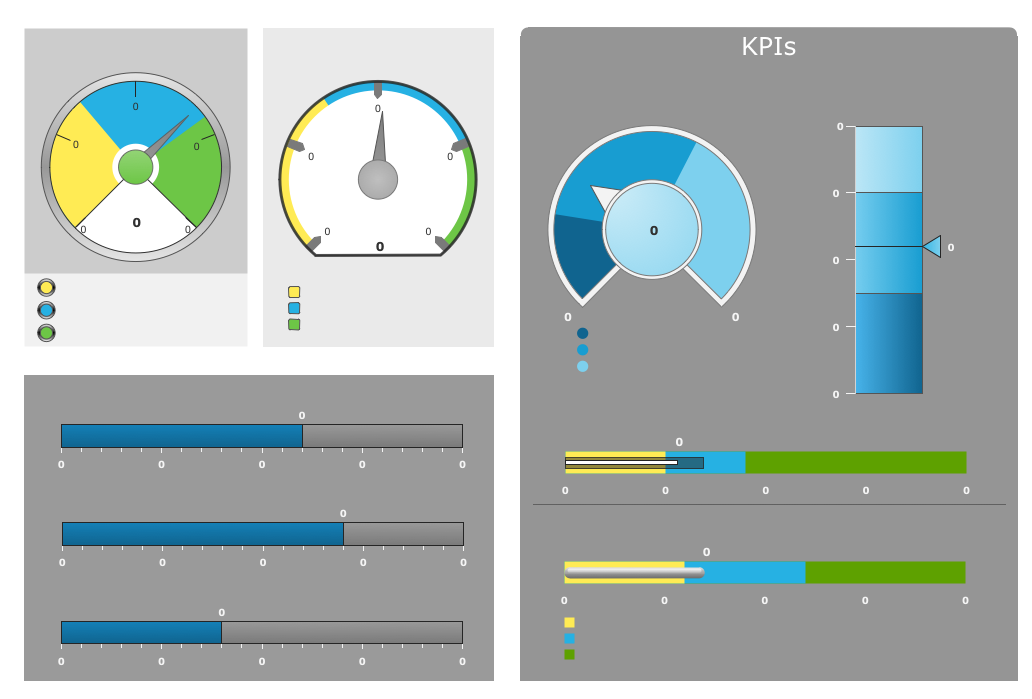
 PM Dashboards
The PM Dashboards solution extends the management boundaries of ConceptDraw DIAGRAM and ConceptDraw PROJECT products with an ability to demonstrate changes to the budget status, to show the project progress toward its objectives, to display clearly the identified key performance indicator (KPI) or the set of key performance indicators for any project. This solution provides you with examples and ability to generate three types of visual dashboards reports based on your project data Project Dashboard, Tactical Dashboard, and Radar Chart. By dynamically charting the project’s key performance indicators that are collected on one ConceptDraw DIAGRAM document page, all project participants, project managers, team members, team leaders, stakeholders, and the entire organizations, for which this solution is intended, have access to the daily status of projects they are involved in.
- PM Dashboards | A KPI Dashboard Provides the Answers Your ...
- Sales KPI Dashboards - Conceptdraw.com
- A KPI Dashboard | A KPI Dashboard Provides the Answers Your ...
- How To Create Project Report | PM Planning | How To Hold Project ...
- A KPI Dashboard Provides the Answers Your Sales Team | A KPI ...
- Website KPIs - Visual dashboard | A KPI Dashboard Provides the ...
- PM Dashboards | Project Management Area ... - Conceptdraw.com
- A KPI Dashboard | A KPI Dashboard Provides the Answers Your ...
- A KPI Dashboard - Conceptdraw.com
- How To Create Project Report | What is a Dashboard Area | |
- PM Dashboards | Project Working With Tasks | Business Diagram ...
- PM Dashboards | How To Create Project Report | Project Exchange |
- PM Dashboards | Status Dashboard | Project tasks dashboard |
- PM Dashboards | How To Create Project Report | What is a ...
- What is a Dashboard Area | Design elements - Sales dashboard ...
- PM Dashboards | Project Exchange | How To Create Project Report |
- Sales Dashboard Solutions can help your sales team keep an eye ...
- Project tasks dashboard
- PM Dashboards | Design elements - Status indicators | Website KPIs ...
- How To Create Project Report | Product Overview | Collaboration in ...