The vector stencils library "Sales KPIs and Metrics" contains 15 chart templates and graphic indicators of sales key performance indicators (KPIs) and metrics.
Use it for drawing sales dashboards in the ConceptDraw PRO diagramming and vector drawing software extended with the Sales Dashboard solution from the Marketing area of ConceptDraw Solution Park.
Use it for drawing sales dashboards in the ConceptDraw PRO diagramming and vector drawing software extended with the Sales Dashboard solution from the Marketing area of ConceptDraw Solution Park.
Actual vs Plan

Average Purchase Value

Clicks from Sales Follow-Up Emails

Cost per customer

Cost per order

Lead Response Time

Opportunity-to-Win Ratio

Product mix

Product Performance

Rate of Contact

Rate of Follow Up Contact

Sales Growth

Sales Target

Social Media Usage

Usage Rate of Marketing Collateral

KPIs and Metrics

A KPI Dashboard Provides the Answers Your Sales Team

KPI Dashboard

Performance Indicators

The Facts and KPIs

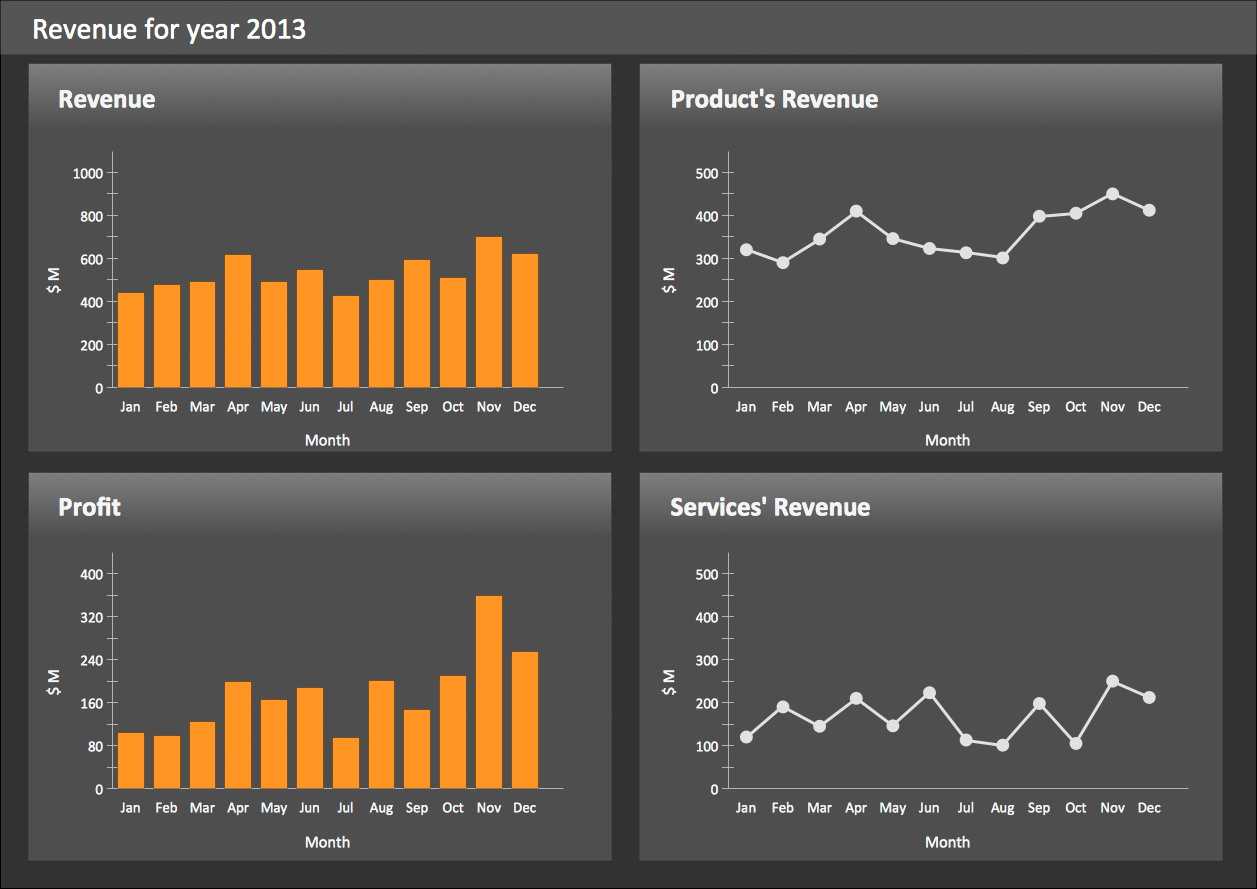
The vector stencils library "Sales KPIs and Metrics" contains 15 chart templates and graphic indicators of sales key performance indicators (KPIs) and metrics for drawing sales dashboards: line charts "Cost per order" and "Clicks from Sales Follow-Up Emails", column charts "Social Media Usage" and "Usage Rate of Marketing Collateral", horizontal bar charts "Rate of Follow Up Contact", "Cost per customer" and "Lead Response Time", pie charts "Product mix", "Product Performance" and "Rate of Contact", gauge (speedometer) indicators "Sales Growth" and "Actual vs Plan", bullet indicator "Sales Target", diamond alarm indicators "Average Purchase Value", "Quote to Close Ratio", "Opportunity-to-Win Ratio" and "Sales Ratio".
The dashboard charts and indicators example "Design elements - Sales KPIs and metrics" for the ConceptDraw PRO diagramming and vector drawing software is included in the Sales Dashboard solution from the Marketing area of ConceptDraw Solution Park.
www.conceptdraw.com/ solution-park/ marketing-sales-dashboard
Sales dashboard charts and graphic indicators

Visualize Sales Data Using Sample Data

What is a KPI?
TQM Diagram — Professional Total Quality Management

 Business Intelligence Dashboard
Business Intelligence Dashboard solution extends the ConceptDraw DIAGRAM functionality with exclusive tools, numerous ready-to-use vector objects, samples and quick-start templates for creation professional Business Intelligence Dashboards, Business Intelligence Graphics, Business Intelligence Charts and Maps of different kinds. Design easy the BI dashboard, BI model or Dynamic chart in ConceptDraw DIAGRAM to monitor the company's work, to track the indicators corresponding your company's data, to display and analyze key performance indicators, to evaluate the trends and regularities of the processes occurring at the company.
Basketball Court Dimensions

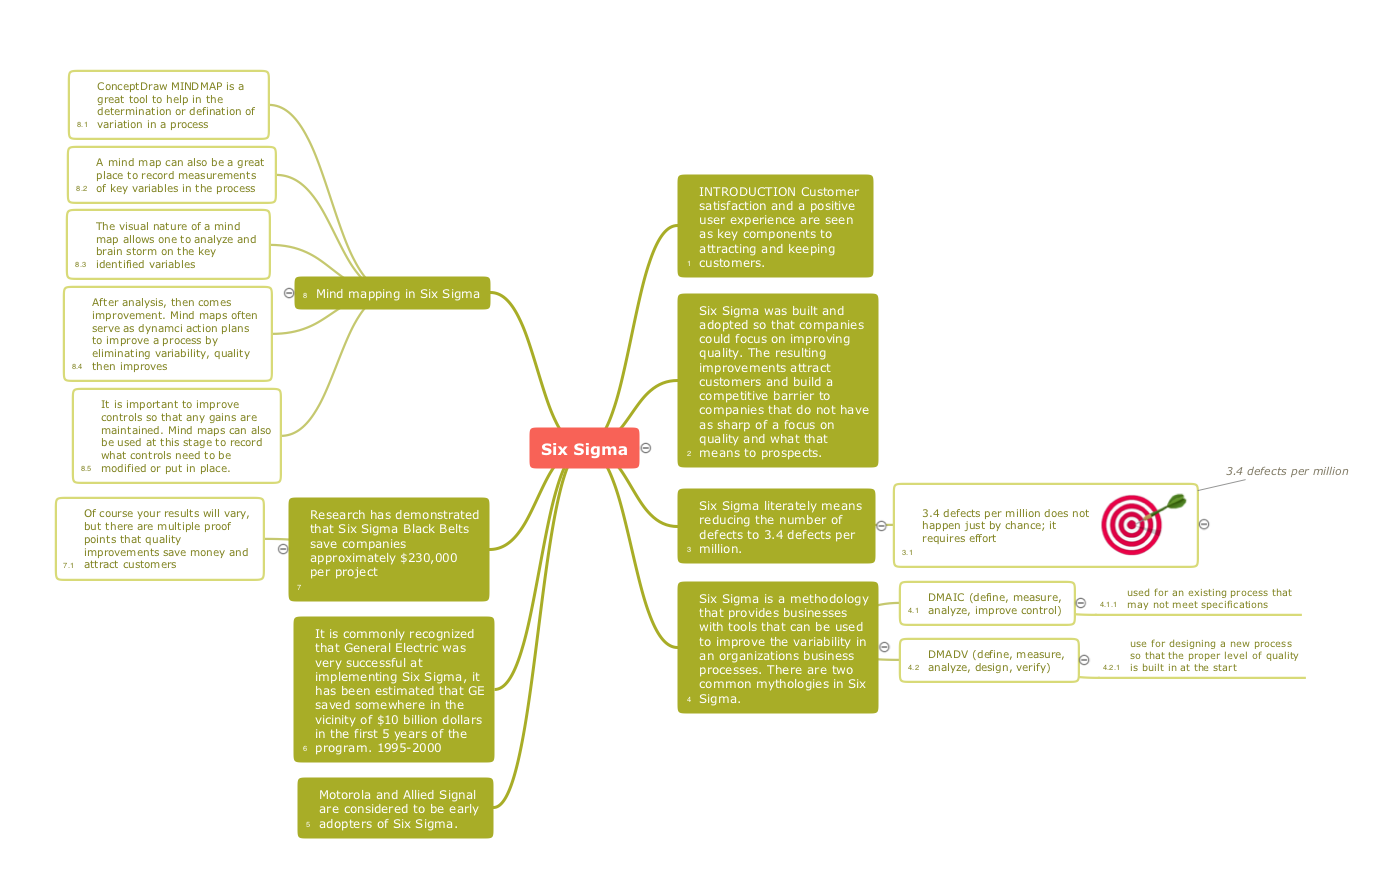
Quality Improvement
 Logistic Dashboard
The powerful tools of Logistic Dashboard solution and specially developed live graphic objects of logistic icons, logistic navigation elements, logistic indicators, logistic charts and logistic maps effectively assist in designing Logistic dashboards, Logistic maps, Logistic charts, diagrams and infographics. The included set of prebuilt samples and quick-start templates, demonstrates the power of ConceptDraw DIAGRAM software in logistics management, its assisting abilities in development, realization and analyzing the logistic processes, as well as in perfection the methods of logistics management.
- KPIs and Metrics | What is a KPI ? | Sales KPIs and Metrics - Vector ...
- Sales KPIs and Metrics - Vector stencils library | Design elements ...
- KPIs and Metrics | KPI Dashboard | The Facts and KPIs | Kpis
- Financial Dashboard Key Metrics
- Performance Indicators | What is a KPI ? | KPIs and Metrics ...
- KPIs and Metrics | Business Intelligence Dashboard | Competitor ...
- KPIs and Metrics | Cross-functional flowchart Templates portrait ...
- KPIs and Metrics | What is a KPI ? | KPI Dashboard | Business Kpi ...
- Key Perfornace Indicators Charts
- KPIs and Metrics | The Facts and KPIs | Sales Dashboards for Your ...
- Cafe performance metrics vs. air temperature - Visual dashboard ...
- Performance Indicators | Constant improvement of key performance ...
- Dashboard | What is a KPI ? | How to Create a Sales Dashboard ...
- Enterprise dashboard | KPI Dashboard | Business Intelligence ...
- KPIs and Metrics | Sales metrics and KPIs - Visual dashboard | Meter ...
- Sales metrics and KPIs - Visual dashboard | Sales KPIs ...
- KPIs and Metrics | Business Intelligence Dashboard | Website ...
- Sales Dashboard | Sales Teams are Inherently Competitive ...
- Sales performance dashboard | Design elements - Sales KPIs and ...
- Design elements - Sales KPIs and metrics | Business Graphics ...