Winter Sports. Olympic Games Infographics. Medal Table

HelpDesk
How to Create a Typography Infographic Using ConceptDraw PRO

Infographic Generator

Typography Infographic Software

Typography Graphic

This example was designed on the base of infographic "Lifestyle Analysis. Method of travel to school in 2011" from the CensusAtSchool Australia website of the Australian Bureau of Statistics (ABS). [abs.gov.au/ websitedbs/ cashome.nsf/ 4a256353001af3ed4b2562bb00121564/ 41b786978bda4617ca25795d0004f35b/ $FILE/ ATT1ZZFV.pdf/ 1infographic_ travel_ 2011.pdf]
"National Summary Tables.
These tables indicate the trends, habits, attitudes and lifestyles of Australian students; however, they don't represent all Australian students, just those who voluntarily completed questionnaires. ...
Tables ... have infographics that you can view and download." [abs.gov.au/ websitedbs/ cashome.nsf/ 4a256353001af3ed4b2562bb00121564/ 1b426c2827e1d7f9ca2578db0015e3b1!OpenDocument]
The infographic example "Lifestyle analysis - Method of travel to school" was created using the ConceptDraw PRO diagramming and vector drawing software extended with the Education Infographics solition from the area "Business Infographics" in ConceptDraw Solution Park.
Educational infogram

Used Solutions
Infographic Tools

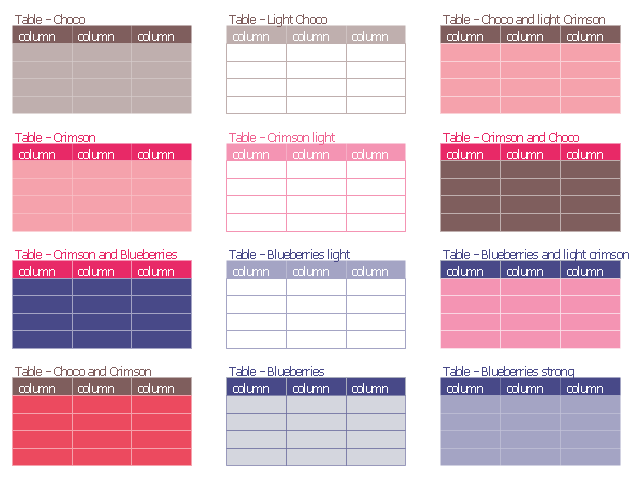
The vector stencils library "Tables" contains 12 table blocks. Use it to add typography elements into your infographics.
"A table is a means of arranging data in rows and columns. The use of tables is pervasive throughout all communication, research and data analysis. Tables appear in print media, handwritten notes, computer software, architectural ornamentation, traffic signs and many other places. The precise conventions and terminology for describing tables varies depending on the context. Further, tables differ significantly in variety, structure, flexibility, notation, representation and use. In books and technical articles, tables are typically presented apart from the main text in numbered and captioned floating blocks." [Table (information). Wikipedia]
The example "Design elements - Tables" was created using the ConceptDraw PRO diagramming and vector drawing software extended with the Typography Infographics solition from the area "What is infographics" in ConceptDraw Solution Park.
Typography infographics elements - Tables
Typography Art

Basic Diagramming


How to Create an Infographic

Winter Sports Vector Clipart. Medal Map. Spatial Infographics

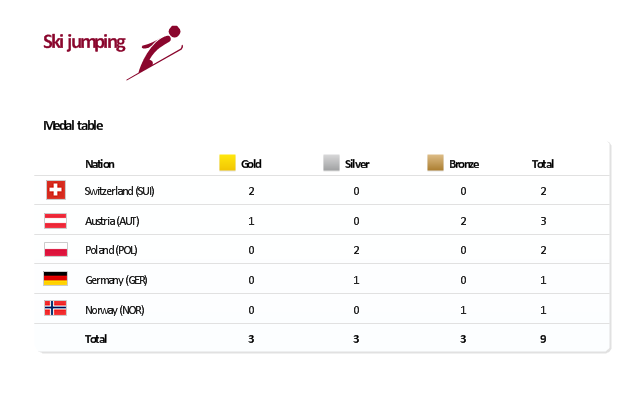
"The ski jumping competition of the Vancouver 2010 Olympics was held at Whistler Olympic Park between 12 and 22 February 2010. ...
For the three events, there are a maximum 70 athletes allowed to compete. No nation can have more than five skiers. For each event, a nation can enter four skiers in individual event or one team in the team event.
Host nation Canada is expected to enter skiers in all events. If no skier meets the qualification standards, they can enter one skier per event.
Quota allocation per nation is based on the World Ranking List (WRL) consisting of Ski Jumping World Cup and Grand Prix points, followed by Continental Cup Standings from the 2008-09 and 2009-10 Ski Jumping World Cup. This will be made by assigning one quota slot per skier from the top of the standings downwards until the maximum five slots have been reached, including host nation Canada." [Ski jumping at the 2010 Winter Olympics. Wikipedia]
This medal table example "Ski jumping at the 2010 Winter Olympics" is created using the ConceptDraw PRO diagramming and vector drawing software extended with the Winter Sports solution.
The Winter Sports solution from the Sport area of ConceptDraw Solution Park contains the vector stencils library "Winter sports pictograms" and examples of diagrams and infographics.
Medal table
- Design elements - Tables | Infographic software: the sample of New ...
- Basic Diagramming | Winter Sports. Olympic Games Infographics ...
- Basic Diagramming | Winter Sports. Olympic Games Infographics ...
- Travel Infographics | Infographic Maker | Infographic Software ...
- How to Create a Typography Infographic Using ConceptDraw PRO ...
- Winter Sports. Olympic Games Infographics . Medal Table ...
- How to Create a Typography Infographic Using ConceptDraw PRO ...
- Infographic Maker | Lifestyle analysis - Method of travel to school ...
- Design elements - Tables | Tables - Vector stencils library | Tables ...
- Winter Sports. Olympic Games Infographics . Medal Table | Winter ...
- How to Create a Typography Infographic Using ConceptDraw PRO ...
- Education Infographics | Educational Technology Tools | Make an ...
- Typography Graphic | How to Create a Typography Infographic ...
- Education Infographics | Educational Materials | Information Graphic ...
- Design Pictorial Infographics . Design Infographics | How to Create a ...
- Winter Sports. Olympic Games Infographics . Medal Table | Winter ...
- Winter sports pictograms - Vector stencils library | Infographic ...
- Seating Plans | Building Drawing Software for Design Seating Plan ...
- Map Infographic Maker | Infographic Maker | ConceptDraw Solution ...
- Marketing Plan Infographic | Gantt chart examples | Types of ...